Immigrants from Switzerland vs Immigrants from Korea In Labor Force | Age 20-64
COMPARE
Immigrants from Switzerland
Immigrants from Korea
In Labor Force | Age 20-64
In Labor Force | Age 20-64 Comparison
Immigrants from Switzerland
Immigrants from Korea
79.6%
IN LABOR FORCE | AGE 20-64
53.3/ 100
METRIC RATING
171st/ 347
METRIC RANK
80.3%
IN LABOR FORCE | AGE 20-64
98.8/ 100
METRIC RATING
63rd/ 347
METRIC RANK
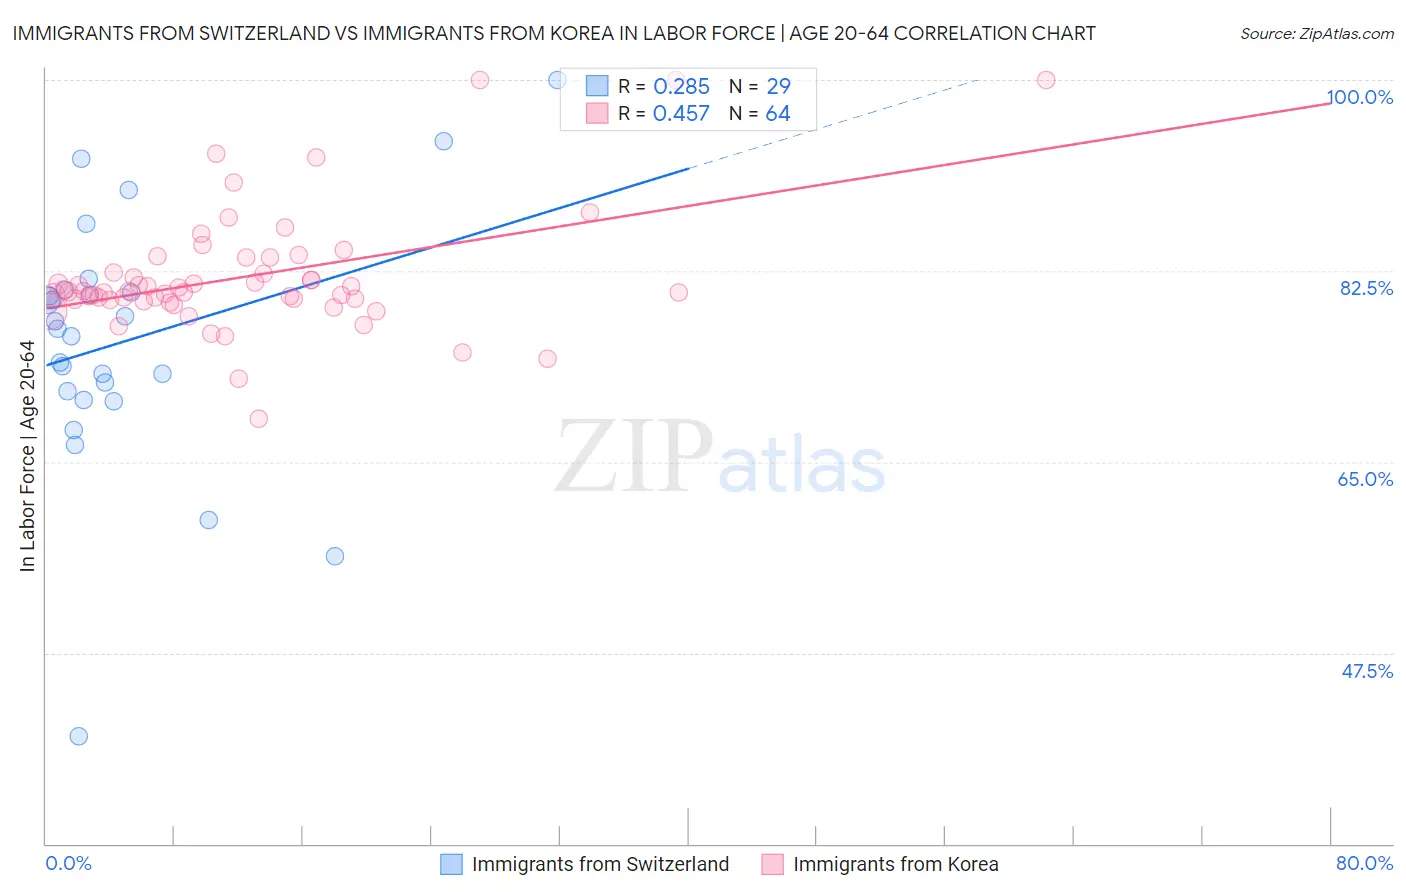
Immigrants from Switzerland vs Immigrants from Korea In Labor Force | Age 20-64 Correlation Chart
The statistical analysis conducted on geographies consisting of 148,083,469 people shows a weak positive correlation between the proportion of Immigrants from Switzerland and labor force participation rate among population between the ages 20 and 64 in the United States with a correlation coefficient (R) of 0.285 and weighted average of 79.6%. Similarly, the statistical analysis conducted on geographies consisting of 416,355,366 people shows a moderate positive correlation between the proportion of Immigrants from Korea and labor force participation rate among population between the ages 20 and 64 in the United States with a correlation coefficient (R) of 0.457 and weighted average of 80.3%, a difference of 0.85%.
In Labor Force | Age 20-64 Correlation Summary
| Measurement | Immigrants from Switzerland | Immigrants from Korea |
| Minimum | 39.8% | 68.9% |
| Maximum | 100.0% | 100.0% |
| Range | 60.2% | 31.1% |
| Mean | 76.1% | 82.0% |
| Median | 77.2% | 80.6% |
| Interquartile 25% (IQ1) | 71.1% | 79.9% |
| Interquartile 75% (IQ3) | 80.6% | 83.1% |
| Interquartile Range (IQR) | 9.6% | 3.2% |
| Standard Deviation (Sample) | 11.8% | 5.6% |
| Standard Deviation (Population) | 11.6% | 5.6% |
Similar Demographics by In Labor Force | Age 20-64
Demographics Similar to Immigrants from Switzerland by In Labor Force | Age 20-64
In terms of in labor force | age 20-64, the demographic groups most similar to Immigrants from Switzerland are Immigrants from Belgium (79.6%, a difference of 0.0%), Slavic (79.6%, a difference of 0.010%), Immigrants from Scotland (79.6%, a difference of 0.010%), Syrian (79.6%, a difference of 0.030%), and Laotian (79.6%, a difference of 0.040%).
| Demographics | Rating | Rank | In Labor Force | Age 20-64 |
| Immigrants | Burma/Myanmar | 64.4 /100 | #164 | Good 79.7% |
| Nigerians | 64.0 /100 | #165 | Good 79.7% |
| Okinawans | 62.7 /100 | #166 | Good 79.6% |
| Immigrants | Iraq | 62.0 /100 | #167 | Good 79.6% |
| Immigrants | Indonesia | 61.8 /100 | #168 | Good 79.6% |
| Laotians | 58.4 /100 | #169 | Average 79.6% |
| Slavs | 54.0 /100 | #170 | Average 79.6% |
| Immigrants | Switzerland | 53.3 /100 | #171 | Average 79.6% |
| Immigrants | Belgium | 53.1 /100 | #172 | Average 79.6% |
| Immigrants | Scotland | 52.4 /100 | #173 | Average 79.6% |
| Syrians | 50.0 /100 | #174 | Average 79.6% |
| Cubans | 46.1 /100 | #175 | Average 79.5% |
| Australians | 46.0 /100 | #176 | Average 79.5% |
| Immigrants | Netherlands | 45.2 /100 | #177 | Average 79.5% |
| Czechoslovakians | 44.3 /100 | #178 | Average 79.5% |
Demographics Similar to Immigrants from Korea by In Labor Force | Age 20-64
In terms of in labor force | age 20-64, the demographic groups most similar to Immigrants from Korea are Immigrants from Albania (80.3%, a difference of 0.0%), Tongan (80.3%, a difference of 0.010%), Burmese (80.3%, a difference of 0.010%), Carpatho Rusyn (80.3%, a difference of 0.010%), and Lithuanian (80.2%, a difference of 0.010%).
| Demographics | Rating | Rank | In Labor Force | Age 20-64 |
| Immigrants | Northern Africa | 99.0 /100 | #56 | Exceptional 80.3% |
| Afghans | 98.9 /100 | #57 | Exceptional 80.3% |
| Serbians | 98.9 /100 | #58 | Exceptional 80.3% |
| Swedes | 98.9 /100 | #59 | Exceptional 80.3% |
| Tongans | 98.8 /100 | #60 | Exceptional 80.3% |
| Burmese | 98.8 /100 | #61 | Exceptional 80.3% |
| Carpatho Rusyns | 98.8 /100 | #62 | Exceptional 80.3% |
| Immigrants | Korea | 98.8 /100 | #63 | Exceptional 80.3% |
| Immigrants | Albania | 98.7 /100 | #64 | Exceptional 80.3% |
| Lithuanians | 98.7 /100 | #65 | Exceptional 80.2% |
| Macedonians | 98.7 /100 | #66 | Exceptional 80.2% |
| Taiwanese | 98.6 /100 | #67 | Exceptional 80.2% |
| Bhutanese | 98.6 /100 | #68 | Exceptional 80.2% |
| Albanians | 98.6 /100 | #69 | Exceptional 80.2% |
| Immigrants | Turkey | 98.5 /100 | #70 | Exceptional 80.2% |