Colville vs Immigrants from China In Labor Force | Age 35-44
COMPARE
Colville
Immigrants from China
In Labor Force | Age 35-44
In Labor Force | Age 35-44 Comparison
Colville
Immigrants from China
81.7%
IN LABOR FORCE | AGE 35-44
0.0/ 100
METRIC RATING
311th/ 347
METRIC RANK
84.7%
IN LABOR FORCE | AGE 35-44
92.3/ 100
METRIC RATING
117th/ 347
METRIC RANK
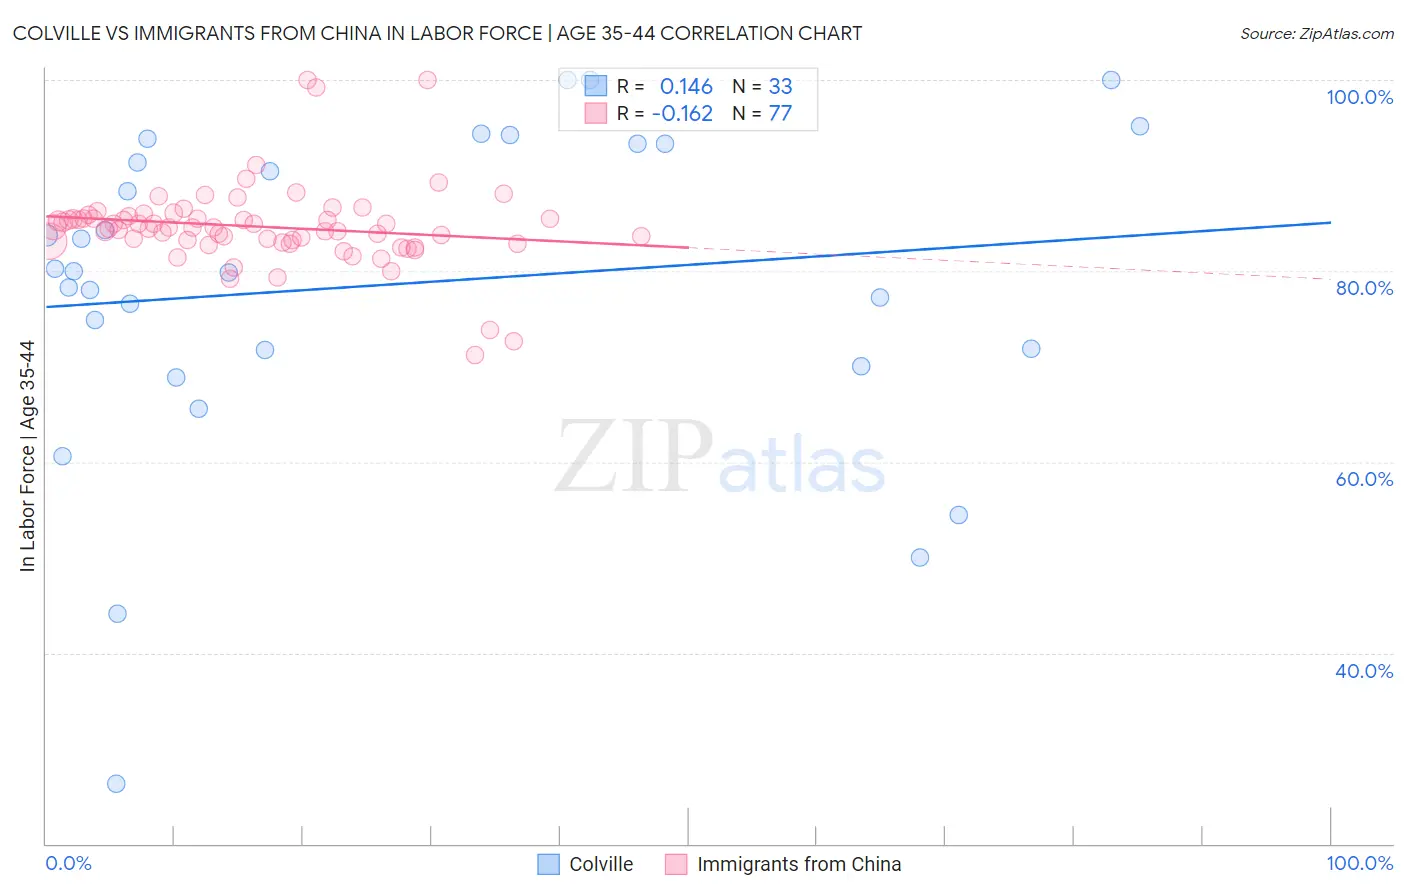
Colville vs Immigrants from China In Labor Force | Age 35-44 Correlation Chart
The statistical analysis conducted on geographies consisting of 34,682,533 people shows a poor positive correlation between the proportion of Colville and labor force participation rate among population between the ages 35 and 44 in the United States with a correlation coefficient (R) of 0.146 and weighted average of 81.7%. Similarly, the statistical analysis conducted on geographies consisting of 456,678,998 people shows a poor negative correlation between the proportion of Immigrants from China and labor force participation rate among population between the ages 35 and 44 in the United States with a correlation coefficient (R) of -0.162 and weighted average of 84.7%, a difference of 3.6%.
In Labor Force | Age 35-44 Correlation Summary
| Measurement | Colville | Immigrants from China |
| Minimum | 26.3% | 71.2% |
| Maximum | 100.0% | 100.0% |
| Range | 73.7% | 28.8% |
| Mean | 78.6% | 84.6% |
| Median | 79.9% | 84.5% |
| Interquartile 25% (IQ1) | 70.8% | 83.1% |
| Interquartile 75% (IQ3) | 93.3% | 85.6% |
| Interquartile Range (IQR) | 22.5% | 2.5% |
| Standard Deviation (Sample) | 17.1% | 4.4% |
| Standard Deviation (Population) | 16.9% | 4.4% |
Similar Demographics by In Labor Force | Age 35-44
Demographics Similar to Colville by In Labor Force | Age 35-44
In terms of in labor force | age 35-44, the demographic groups most similar to Colville are Alaska Native (81.6%, a difference of 0.14%), Mexican (81.6%, a difference of 0.15%), Blackfeet (81.9%, a difference of 0.17%), Cajun (81.5%, a difference of 0.26%), and Immigrants from Mexico (81.5%, a difference of 0.28%).
| Demographics | Rating | Rank | In Labor Force | Age 35-44 |
| Marshallese | 0.0 /100 | #304 | Tragic 82.4% |
| Shoshone | 0.0 /100 | #305 | Tragic 82.2% |
| Blacks/African Americans | 0.0 /100 | #306 | Tragic 82.2% |
| Hispanics or Latinos | 0.0 /100 | #307 | Tragic 82.1% |
| Immigrants | Central America | 0.0 /100 | #308 | Tragic 82.0% |
| Cree | 0.0 /100 | #309 | Tragic 82.0% |
| Blackfeet | 0.0 /100 | #310 | Tragic 81.9% |
| Colville | 0.0 /100 | #311 | Tragic 81.7% |
| Alaska Natives | 0.0 /100 | #312 | Tragic 81.6% |
| Mexicans | 0.0 /100 | #313 | Tragic 81.6% |
| Cajuns | 0.0 /100 | #314 | Tragic 81.5% |
| Immigrants | Mexico | 0.0 /100 | #315 | Tragic 81.5% |
| Comanche | 0.0 /100 | #316 | Tragic 81.5% |
| Cherokee | 0.0 /100 | #317 | Tragic 81.4% |
| Alaskan Athabascans | 0.0 /100 | #318 | Tragic 81.3% |
Demographics Similar to Immigrants from China by In Labor Force | Age 35-44
In terms of in labor force | age 35-44, the demographic groups most similar to Immigrants from China are Immigrants from Eastern Asia (84.7%, a difference of 0.0%), Immigrants from Egypt (84.7%, a difference of 0.010%), Burmese (84.7%, a difference of 0.010%), Uruguayan (84.7%, a difference of 0.020%), and Chilean (84.7%, a difference of 0.020%).
| Demographics | Rating | Rank | In Labor Force | Age 35-44 |
| Filipinos | 93.8 /100 | #110 | Exceptional 84.7% |
| Ukrainians | 93.5 /100 | #111 | Exceptional 84.7% |
| Immigrants | Western Africa | 93.4 /100 | #112 | Exceptional 84.7% |
| Uruguayans | 93.3 /100 | #113 | Exceptional 84.7% |
| Chileans | 93.2 /100 | #114 | Exceptional 84.7% |
| Bahamians | 93.2 /100 | #115 | Exceptional 84.7% |
| Immigrants | Egypt | 92.7 /100 | #116 | Exceptional 84.7% |
| Immigrants | China | 92.3 /100 | #117 | Exceptional 84.7% |
| Immigrants | Eastern Asia | 92.1 /100 | #118 | Exceptional 84.7% |
| Burmese | 91.8 /100 | #119 | Exceptional 84.7% |
| Immigrants | Northern Europe | 91.5 /100 | #120 | Exceptional 84.7% |
| Finns | 91.2 /100 | #121 | Exceptional 84.7% |
| Germans | 91.0 /100 | #122 | Exceptional 84.7% |
| Immigrants | South America | 90.9 /100 | #123 | Exceptional 84.7% |
| Slavs | 90.8 /100 | #124 | Exceptional 84.7% |