Immigrants from Mexico vs Immigrants from Iran In Labor Force | Age 16-19
COMPARE
Immigrants from Mexico
Immigrants from Iran
In Labor Force | Age 16-19
In Labor Force | Age 16-19 Comparison
Immigrants from Mexico
Immigrants from Iran
35.1%
IN LABOR FORCE | AGE 16-19
4.2/ 100
METRIC RATING
234th/ 347
METRIC RANK
32.0%
IN LABOR FORCE | AGE 16-19
0.0/ 100
METRIC RATING
310th/ 347
METRIC RANK
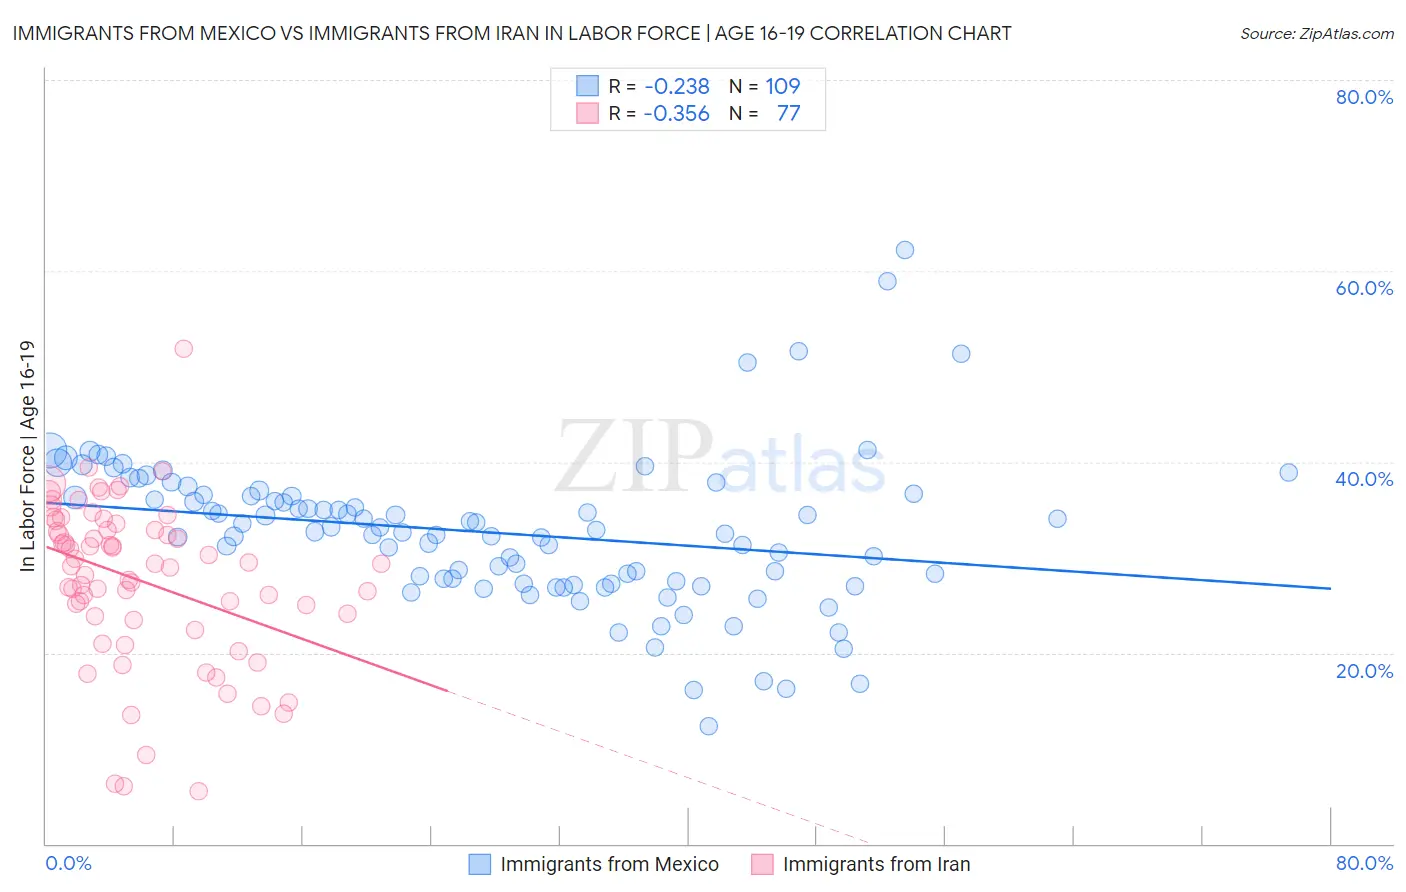
Immigrants from Mexico vs Immigrants from Iran In Labor Force | Age 16-19 Correlation Chart
The statistical analysis conducted on geographies consisting of 511,656,414 people shows a weak negative correlation between the proportion of Immigrants from Mexico and labor force participation rate among population between the ages 16 and 19 in the United States with a correlation coefficient (R) of -0.238 and weighted average of 35.1%. Similarly, the statistical analysis conducted on geographies consisting of 279,510,486 people shows a mild negative correlation between the proportion of Immigrants from Iran and labor force participation rate among population between the ages 16 and 19 in the United States with a correlation coefficient (R) of -0.356 and weighted average of 32.0%, a difference of 9.9%.
In Labor Force | Age 16-19 Correlation Summary
| Measurement | Immigrants from Mexico | Immigrants from Iran |
| Minimum | 12.3% | 5.5% |
| Maximum | 62.2% | 51.8% |
| Range | 49.9% | 46.3% |
| Mean | 32.6% | 27.6% |
| Median | 32.7% | 29.3% |
| Interquartile 25% (IQ1) | 27.4% | 23.6% |
| Interquartile 75% (IQ3) | 36.5% | 33.2% |
| Interquartile Range (IQR) | 9.1% | 9.6% |
| Standard Deviation (Sample) | 7.9% | 8.5% |
| Standard Deviation (Population) | 7.9% | 8.5% |
Similar Demographics by In Labor Force | Age 16-19
Demographics Similar to Immigrants from Mexico by In Labor Force | Age 16-19
In terms of in labor force | age 16-19, the demographic groups most similar to Immigrants from Mexico are Immigrants from France (35.1%, a difference of 0.040%), Immigrants from Syria (35.2%, a difference of 0.080%), Immigrants from Kazakhstan (35.2%, a difference of 0.080%), Immigrants from Philippines (35.1%, a difference of 0.080%), and Immigrants from Honduras (35.2%, a difference of 0.20%).
| Demographics | Rating | Rank | In Labor Force | Age 16-19 |
| Mongolians | 5.7 /100 | #227 | Tragic 35.3% |
| Immigrants | Senegal | 5.5 /100 | #228 | Tragic 35.3% |
| Immigrants | Lebanon | 5.0 /100 | #229 | Tragic 35.2% |
| Immigrants | Honduras | 4.9 /100 | #230 | Tragic 35.2% |
| Immigrants | Syria | 4.5 /100 | #231 | Tragic 35.2% |
| Immigrants | Kazakhstan | 4.5 /100 | #232 | Tragic 35.2% |
| Immigrants | France | 4.3 /100 | #233 | Tragic 35.1% |
| Immigrants | Mexico | 4.2 /100 | #234 | Tragic 35.1% |
| Immigrants | Philippines | 4.0 /100 | #235 | Tragic 35.1% |
| Immigrants | Australia | 3.6 /100 | #236 | Tragic 35.1% |
| Immigrants | India | 3.5 /100 | #237 | Tragic 35.0% |
| Immigrants | Vietnam | 3.4 /100 | #238 | Tragic 35.0% |
| Inupiat | 3.2 /100 | #239 | Tragic 35.0% |
| Immigrants | Central America | 3.0 /100 | #240 | Tragic 35.0% |
| Immigrants | Ireland | 2.9 /100 | #241 | Tragic 35.0% |
Demographics Similar to Immigrants from Iran by In Labor Force | Age 16-19
In terms of in labor force | age 16-19, the demographic groups most similar to Immigrants from Iran are Immigrants from Eastern Asia (32.0%, a difference of 0.14%), Navajo (32.1%, a difference of 0.32%), Indian (Asian) (31.9%, a difference of 0.37%), Immigrants from Belize (31.8%, a difference of 0.51%), and Hopi (31.8%, a difference of 0.51%).
| Demographics | Rating | Rank | In Labor Force | Age 16-19 |
| Immigrants | Dominica | 0.0 /100 | #303 | Tragic 32.5% |
| Israelis | 0.0 /100 | #304 | Tragic 32.4% |
| Nicaraguans | 0.0 /100 | #305 | Tragic 32.4% |
| Spanish American Indians | 0.0 /100 | #306 | Tragic 32.4% |
| Immigrants | Jamaica | 0.0 /100 | #307 | Tragic 32.2% |
| Navajo | 0.0 /100 | #308 | Tragic 32.1% |
| Immigrants | Eastern Asia | 0.0 /100 | #309 | Tragic 32.0% |
| Immigrants | Iran | 0.0 /100 | #310 | Tragic 32.0% |
| Indians (Asian) | 0.0 /100 | #311 | Tragic 31.9% |
| Immigrants | Belize | 0.0 /100 | #312 | Tragic 31.8% |
| Hopi | 0.0 /100 | #313 | Tragic 31.8% |
| Cubans | 0.0 /100 | #314 | Tragic 31.8% |
| Immigrants | West Indies | 0.0 /100 | #315 | Tragic 31.7% |
| Filipinos | 0.0 /100 | #316 | Tragic 31.7% |
| Immigrants | Nicaragua | 0.0 /100 | #317 | Tragic 31.6% |