Romanian vs Immigrants from Iran In Labor Force | Age 16-19
COMPARE
Romanian
Immigrants from Iran
In Labor Force | Age 16-19
In Labor Force | Age 16-19 Comparison
Romanians
Immigrants from Iran
37.5%
IN LABOR FORCE | AGE 16-19
87.3/ 100
METRIC RATING
148th/ 347
METRIC RANK
32.0%
IN LABOR FORCE | AGE 16-19
0.0/ 100
METRIC RATING
310th/ 347
METRIC RANK
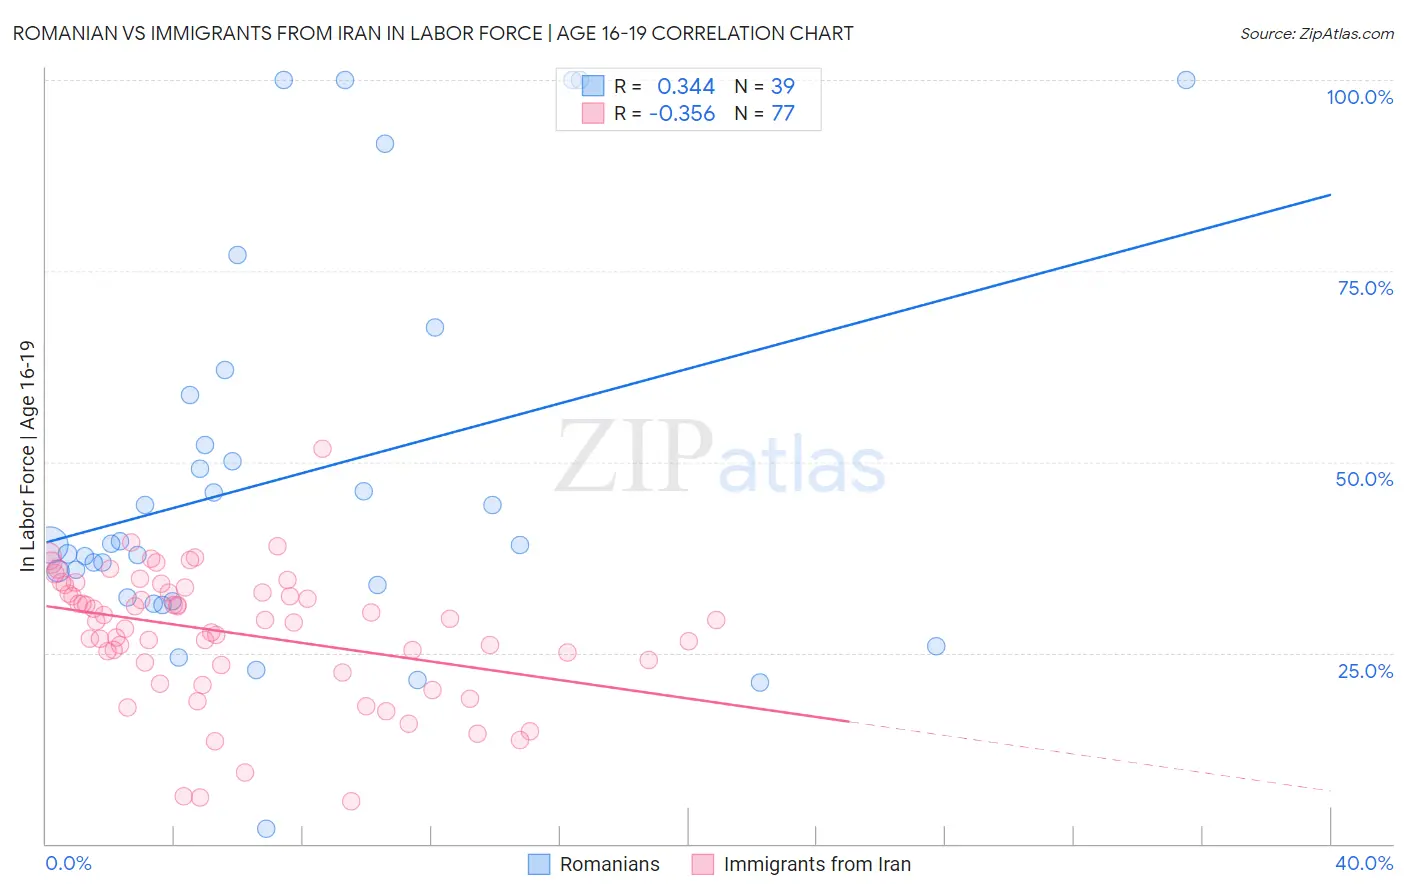
Romanian vs Immigrants from Iran In Labor Force | Age 16-19 Correlation Chart
The statistical analysis conducted on geographies consisting of 377,266,020 people shows a mild positive correlation between the proportion of Romanians and labor force participation rate among population between the ages 16 and 19 in the United States with a correlation coefficient (R) of 0.344 and weighted average of 37.5%. Similarly, the statistical analysis conducted on geographies consisting of 279,510,486 people shows a mild negative correlation between the proportion of Immigrants from Iran and labor force participation rate among population between the ages 16 and 19 in the United States with a correlation coefficient (R) of -0.356 and weighted average of 32.0%, a difference of 17.1%.
In Labor Force | Age 16-19 Correlation Summary
| Measurement | Romanian | Immigrants from Iran |
| Minimum | 2.0% | 5.5% |
| Maximum | 100.0% | 51.8% |
| Range | 98.0% | 46.3% |
| Mean | 48.3% | 27.6% |
| Median | 39.2% | 29.3% |
| Interquartile 25% (IQ1) | 32.2% | 23.6% |
| Interquartile 75% (IQ3) | 58.7% | 33.2% |
| Interquartile Range (IQR) | 26.5% | 9.6% |
| Standard Deviation (Sample) | 25.5% | 8.5% |
| Standard Deviation (Population) | 25.2% | 8.5% |
Similar Demographics by In Labor Force | Age 16-19
Demographics Similar to Romanians by In Labor Force | Age 16-19
In terms of in labor force | age 16-19, the demographic groups most similar to Romanians are Brazilian (37.5%, a difference of 0.16%), Immigrants from Western Europe (37.5%, a difference of 0.19%), Japanese (37.5%, a difference of 0.24%), Paiute (37.5%, a difference of 0.24%), and Native Hawaiian (37.4%, a difference of 0.24%).
| Demographics | Rating | Rank | In Labor Force | Age 16-19 |
| Syrians | 90.7 /100 | #141 | Exceptional 37.6% |
| Sierra Leoneans | 89.7 /100 | #142 | Excellent 37.6% |
| Pakistanis | 89.5 /100 | #143 | Excellent 37.6% |
| Japanese | 89.3 /100 | #144 | Excellent 37.5% |
| Paiute | 89.3 /100 | #145 | Excellent 37.5% |
| Immigrants | Western Europe | 88.9 /100 | #146 | Excellent 37.5% |
| Brazilians | 88.7 /100 | #147 | Excellent 37.5% |
| Romanians | 87.3 /100 | #148 | Excellent 37.5% |
| Native Hawaiians | 85.0 /100 | #149 | Excellent 37.4% |
| Tsimshian | 84.7 /100 | #150 | Excellent 37.4% |
| Immigrants | Poland | 84.4 /100 | #151 | Excellent 37.3% |
| Immigrants | Sierra Leone | 83.6 /100 | #152 | Excellent 37.3% |
| Arapaho | 81.8 /100 | #153 | Excellent 37.3% |
| Immigrants | Bulgaria | 81.6 /100 | #154 | Excellent 37.3% |
| Immigrants | Lithuania | 80.7 /100 | #155 | Excellent 37.2% |
Demographics Similar to Immigrants from Iran by In Labor Force | Age 16-19
In terms of in labor force | age 16-19, the demographic groups most similar to Immigrants from Iran are Immigrants from Eastern Asia (32.0%, a difference of 0.14%), Navajo (32.1%, a difference of 0.32%), Indian (Asian) (31.9%, a difference of 0.37%), Immigrants from Belize (31.8%, a difference of 0.51%), and Hopi (31.8%, a difference of 0.51%).
| Demographics | Rating | Rank | In Labor Force | Age 16-19 |
| Immigrants | Dominica | 0.0 /100 | #303 | Tragic 32.5% |
| Israelis | 0.0 /100 | #304 | Tragic 32.4% |
| Nicaraguans | 0.0 /100 | #305 | Tragic 32.4% |
| Spanish American Indians | 0.0 /100 | #306 | Tragic 32.4% |
| Immigrants | Jamaica | 0.0 /100 | #307 | Tragic 32.2% |
| Navajo | 0.0 /100 | #308 | Tragic 32.1% |
| Immigrants | Eastern Asia | 0.0 /100 | #309 | Tragic 32.0% |
| Immigrants | Iran | 0.0 /100 | #310 | Tragic 32.0% |
| Indians (Asian) | 0.0 /100 | #311 | Tragic 31.9% |
| Immigrants | Belize | 0.0 /100 | #312 | Tragic 31.8% |
| Hopi | 0.0 /100 | #313 | Tragic 31.8% |
| Cubans | 0.0 /100 | #314 | Tragic 31.8% |
| Immigrants | West Indies | 0.0 /100 | #315 | Tragic 31.7% |
| Filipinos | 0.0 /100 | #316 | Tragic 31.7% |
| Immigrants | Nicaragua | 0.0 /100 | #317 | Tragic 31.6% |