Immigrants from Kenya vs Immigrants from Jamaica In Labor Force | Age 25-29
COMPARE
Immigrants from Kenya
Immigrants from Jamaica
In Labor Force | Age 25-29
In Labor Force | Age 25-29 Comparison
Immigrants from Kenya
Immigrants from Jamaica
85.4%
IN LABOR FORCE | AGE 25-29
99.4/ 100
METRIC RATING
63rd/ 347
METRIC RANK
83.8%
IN LABOR FORCE | AGE 25-29
0.4/ 100
METRIC RATING
244th/ 347
METRIC RANK
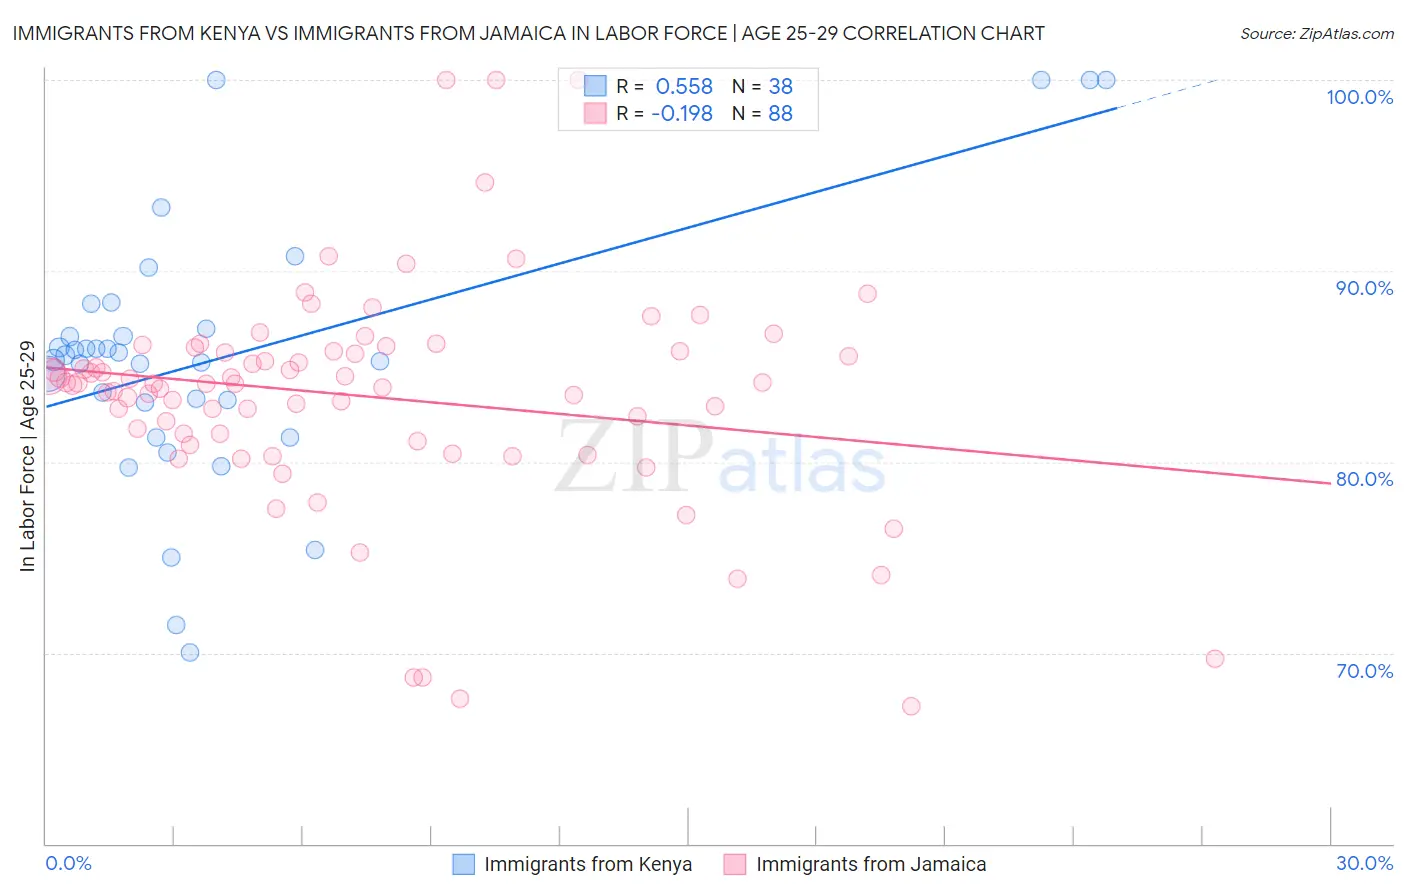
Immigrants from Kenya vs Immigrants from Jamaica In Labor Force | Age 25-29 Correlation Chart
The statistical analysis conducted on geographies consisting of 218,069,708 people shows a substantial positive correlation between the proportion of Immigrants from Kenya and labor force participation rate among population between the ages 25 and 29 in the United States with a correlation coefficient (R) of 0.558 and weighted average of 85.4%. Similarly, the statistical analysis conducted on geographies consisting of 301,725,989 people shows a poor negative correlation between the proportion of Immigrants from Jamaica and labor force participation rate among population between the ages 25 and 29 in the United States with a correlation coefficient (R) of -0.198 and weighted average of 83.8%, a difference of 2.0%.
In Labor Force | Age 25-29 Correlation Summary
| Measurement | Immigrants from Kenya | Immigrants from Jamaica |
| Minimum | 70.0% | 67.2% |
| Maximum | 100.0% | 100.0% |
| Range | 30.0% | 32.8% |
| Mean | 85.5% | 83.4% |
| Median | 85.5% | 84.1% |
| Interquartile 25% (IQ1) | 83.1% | 81.3% |
| Interquartile 75% (IQ3) | 87.0% | 85.8% |
| Interquartile Range (IQR) | 3.9% | 4.5% |
| Standard Deviation (Sample) | 6.9% | 5.9% |
| Standard Deviation (Population) | 6.8% | 5.9% |
Similar Demographics by In Labor Force | Age 25-29
Demographics Similar to Immigrants from Kenya by In Labor Force | Age 25-29
In terms of in labor force | age 25-29, the demographic groups most similar to Immigrants from Kenya are Taiwanese (85.4%, a difference of 0.010%), Thai (85.5%, a difference of 0.020%), Serbian (85.5%, a difference of 0.020%), Immigrants from Italy (85.4%, a difference of 0.020%), and Immigrants from Czechoslovakia (85.4%, a difference of 0.030%).
| Demographics | Rating | Rank | In Labor Force | Age 25-29 |
| Eastern Europeans | 99.6 /100 | #56 | Exceptional 85.5% |
| Estonians | 99.6 /100 | #57 | Exceptional 85.5% |
| Greeks | 99.6 /100 | #58 | Exceptional 85.5% |
| Immigrants | Morocco | 99.5 /100 | #59 | Exceptional 85.5% |
| Thais | 99.5 /100 | #60 | Exceptional 85.5% |
| Serbians | 99.5 /100 | #61 | Exceptional 85.5% |
| Taiwanese | 99.4 /100 | #62 | Exceptional 85.4% |
| Immigrants | Kenya | 99.4 /100 | #63 | Exceptional 85.4% |
| Immigrants | Italy | 99.3 /100 | #64 | Exceptional 85.4% |
| Immigrants | Czechoslovakia | 99.3 /100 | #65 | Exceptional 85.4% |
| Immigrants | Scotland | 99.3 /100 | #66 | Exceptional 85.4% |
| Immigrants | Turkey | 99.2 /100 | #67 | Exceptional 85.4% |
| Immigrants | Cameroon | 99.2 /100 | #68 | Exceptional 85.4% |
| Menominee | 99.1 /100 | #69 | Exceptional 85.4% |
| Immigrants | Sweden | 99.1 /100 | #70 | Exceptional 85.4% |
Demographics Similar to Immigrants from Jamaica by In Labor Force | Age 25-29
In terms of in labor force | age 25-29, the demographic groups most similar to Immigrants from Jamaica are Iroquois (83.8%, a difference of 0.0%), Salvadoran (83.8%, a difference of 0.040%), U.S. Virgin Islander (83.8%, a difference of 0.050%), Cree (83.8%, a difference of 0.050%), and Immigrants from El Salvador (83.7%, a difference of 0.070%).
| Demographics | Rating | Rank | In Labor Force | Age 25-29 |
| Immigrants | Immigrants | 0.9 /100 | #237 | Tragic 83.9% |
| Immigrants | Uzbekistan | 0.8 /100 | #238 | Tragic 83.9% |
| Jamaicans | 0.8 /100 | #239 | Tragic 83.9% |
| Trinidadians and Tobagonians | 0.7 /100 | #240 | Tragic 83.9% |
| Alsatians | 0.7 /100 | #241 | Tragic 83.9% |
| U.S. Virgin Islanders | 0.6 /100 | #242 | Tragic 83.8% |
| Salvadorans | 0.5 /100 | #243 | Tragic 83.8% |
| Immigrants | Jamaica | 0.4 /100 | #244 | Tragic 83.8% |
| Iroquois | 0.4 /100 | #245 | Tragic 83.8% |
| Cree | 0.3 /100 | #246 | Tragic 83.8% |
| Immigrants | El Salvador | 0.3 /100 | #247 | Tragic 83.7% |
| Immigrants | Nonimmigrants | 0.3 /100 | #248 | Tragic 83.7% |
| Hmong | 0.3 /100 | #249 | Tragic 83.7% |
| Central Americans | 0.2 /100 | #250 | Tragic 83.7% |
| Bahamians | 0.2 /100 | #251 | Tragic 83.7% |