Senegalese vs Immigrants from Brazil In Labor Force | Age 20-64
COMPARE
Senegalese
Immigrants from Brazil
In Labor Force | Age 20-64
In Labor Force | Age 20-64 Comparison
Senegalese
Immigrants from Brazil
79.7%
IN LABOR FORCE | AGE 20-64
69.1/ 100
METRIC RATING
156th/ 347
METRIC RANK
80.7%
IN LABOR FORCE | AGE 20-64
99.9/ 100
METRIC RATING
34th/ 347
METRIC RANK
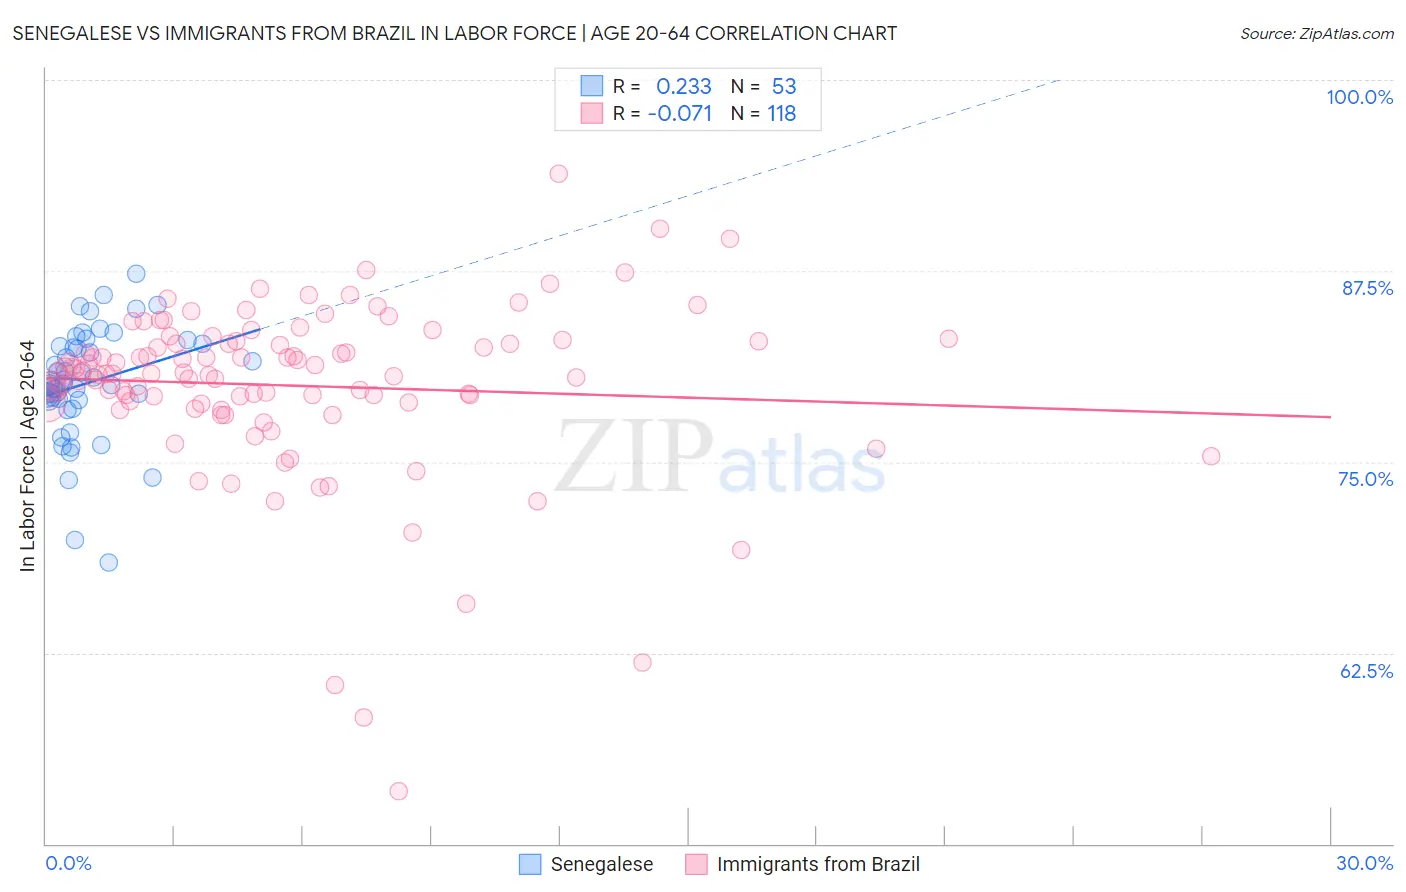
Senegalese vs Immigrants from Brazil In Labor Force | Age 20-64 Correlation Chart
The statistical analysis conducted on geographies consisting of 78,141,567 people shows a weak positive correlation between the proportion of Senegalese and labor force participation rate among population between the ages 20 and 64 in the United States with a correlation coefficient (R) of 0.233 and weighted average of 79.7%. Similarly, the statistical analysis conducted on geographies consisting of 343,008,665 people shows a slight negative correlation between the proportion of Immigrants from Brazil and labor force participation rate among population between the ages 20 and 64 in the United States with a correlation coefficient (R) of -0.071 and weighted average of 80.7%, a difference of 1.2%.
In Labor Force | Age 20-64 Correlation Summary
| Measurement | Senegalese | Immigrants from Brazil |
| Minimum | 68.4% | 53.4% |
| Maximum | 87.3% | 93.9% |
| Range | 18.9% | 40.5% |
| Mean | 80.2% | 80.0% |
| Median | 80.1% | 80.8% |
| Interquartile 25% (IQ1) | 79.0% | 78.8% |
| Interquartile 75% (IQ3) | 82.7% | 82.9% |
| Interquartile Range (IQR) | 3.6% | 4.1% |
| Standard Deviation (Sample) | 3.7% | 5.8% |
| Standard Deviation (Population) | 3.7% | 5.8% |
Similar Demographics by In Labor Force | Age 20-64
Demographics Similar to Senegalese by In Labor Force | Age 20-64
In terms of in labor force | age 20-64, the demographic groups most similar to Senegalese are Immigrants from Kazakhstan (79.7%, a difference of 0.0%), New Zealander (79.7%, a difference of 0.0%), Immigrants from South Africa (79.7%, a difference of 0.0%), Immigrants from China (79.7%, a difference of 0.0%), and Austrian (79.7%, a difference of 0.010%).
| Demographics | Rating | Rank | In Labor Force | Age 20-64 |
| Icelanders | 75.1 /100 | #149 | Good 79.7% |
| Costa Ricans | 72.4 /100 | #150 | Good 79.7% |
| Scandinavians | 72.0 /100 | #151 | Good 79.7% |
| Immigrants | Northern Europe | 72.0 /100 | #152 | Good 79.7% |
| Immigrants | Kazakhstan | 69.5 /100 | #153 | Good 79.7% |
| New Zealanders | 69.4 /100 | #154 | Good 79.7% |
| Immigrants | South Africa | 69.2 /100 | #155 | Good 79.7% |
| Senegalese | 69.1 /100 | #156 | Good 79.7% |
| Immigrants | China | 69.1 /100 | #157 | Good 79.7% |
| Austrians | 67.6 /100 | #158 | Good 79.7% |
| Immigrants | Cuba | 66.7 /100 | #159 | Good 79.7% |
| Moroccans | 66.7 /100 | #160 | Good 79.7% |
| South Africans | 66.2 /100 | #161 | Good 79.7% |
| Germans | 65.2 /100 | #162 | Good 79.7% |
| Immigrants | Costa Rica | 64.6 /100 | #163 | Good 79.7% |
Demographics Similar to Immigrants from Brazil by In Labor Force | Age 20-64
In terms of in labor force | age 20-64, the demographic groups most similar to Immigrants from Brazil are Chinese (80.7%, a difference of 0.020%), Immigrants from Poland (80.6%, a difference of 0.030%), Immigrants from Ireland (80.7%, a difference of 0.060%), Immigrants from Lithuania (80.7%, a difference of 0.070%), and Immigrants from South Central Asia (80.7%, a difference of 0.090%).
| Demographics | Rating | Rank | In Labor Force | Age 20-64 |
| Immigrants | Kenya | 99.9 /100 | #27 | Exceptional 80.7% |
| Immigrants | Uganda | 99.9 /100 | #28 | Exceptional 80.7% |
| Immigrants | South Central Asia | 99.9 /100 | #29 | Exceptional 80.7% |
| Immigrants | North Macedonia | 99.9 /100 | #30 | Exceptional 80.7% |
| Immigrants | Lithuania | 99.9 /100 | #31 | Exceptional 80.7% |
| Immigrants | Ireland | 99.9 /100 | #32 | Exceptional 80.7% |
| Chinese | 99.9 /100 | #33 | Exceptional 80.7% |
| Immigrants | Brazil | 99.9 /100 | #34 | Exceptional 80.7% |
| Immigrants | Poland | 99.9 /100 | #35 | Exceptional 80.6% |
| Paraguayans | 99.8 /100 | #36 | Exceptional 80.6% |
| Immigrants | Moldova | 99.8 /100 | #37 | Exceptional 80.6% |
| Ugandans | 99.8 /100 | #38 | Exceptional 80.6% |
| Brazilians | 99.8 /100 | #39 | Exceptional 80.5% |
| Immigrants | Zimbabwe | 99.8 /100 | #40 | Exceptional 80.5% |
| Immigrants | Liberia | 99.8 /100 | #41 | Exceptional 80.5% |