Immigrants from Fiji vs Immigrants from South Central Asia In Labor Force | Age 25-29
COMPARE
Immigrants from Fiji
Immigrants from South Central Asia
In Labor Force | Age 25-29
In Labor Force | Age 25-29 Comparison
Immigrants from Fiji
Immigrants from South Central Asia
83.6%
IN LABOR FORCE | AGE 25-29
0.1/ 100
METRIC RATING
262nd/ 347
METRIC RANK
85.2%
IN LABOR FORCE | AGE 25-29
97.9/ 100
METRIC RATING
77th/ 347
METRIC RANK
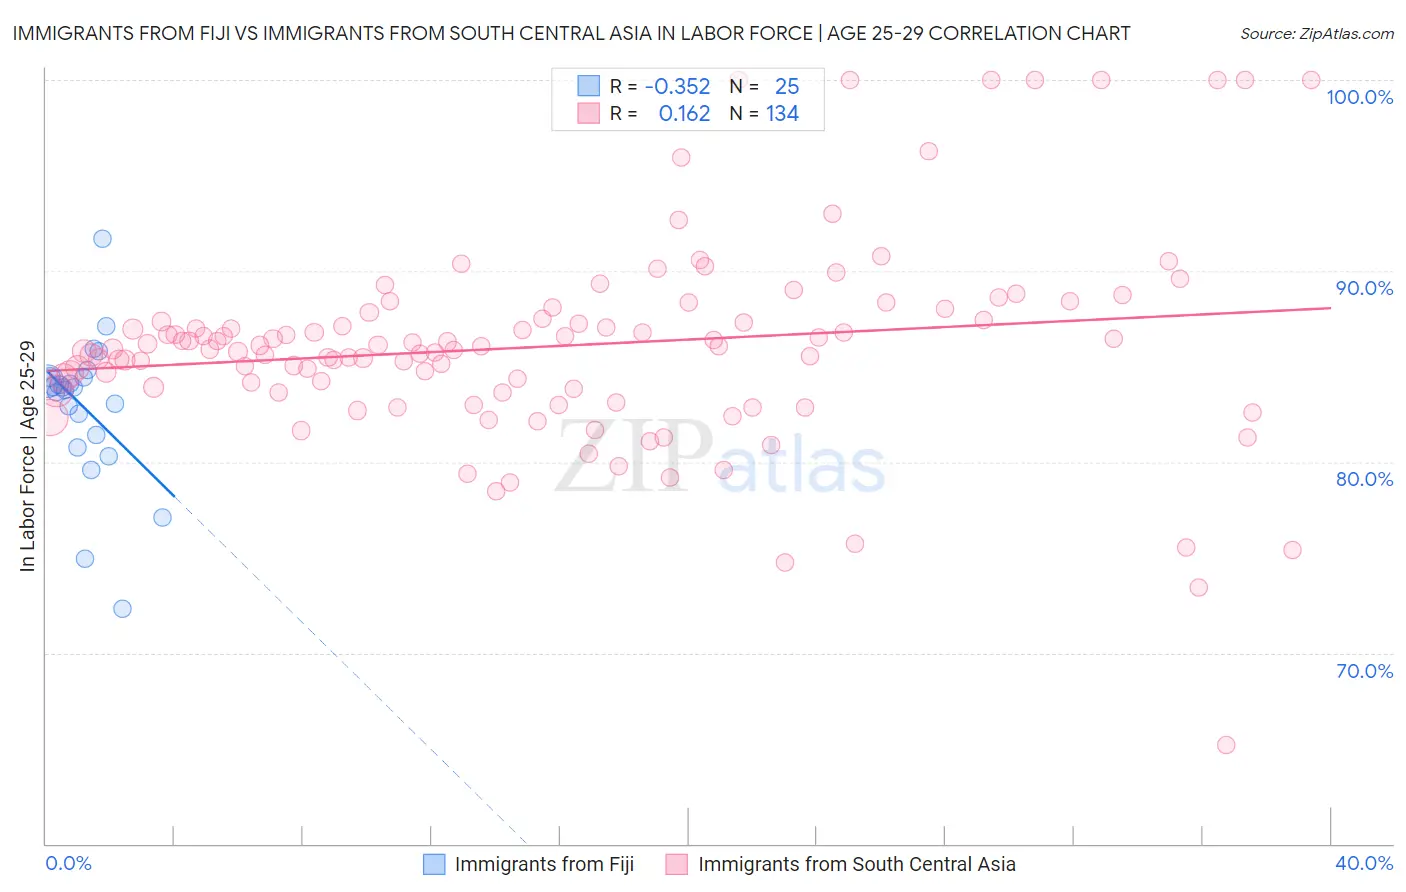
Immigrants from Fiji vs Immigrants from South Central Asia In Labor Force | Age 25-29 Correlation Chart
The statistical analysis conducted on geographies consisting of 93,752,229 people shows a mild negative correlation between the proportion of Immigrants from Fiji and labor force participation rate among population between the ages 25 and 29 in the United States with a correlation coefficient (R) of -0.352 and weighted average of 83.6%. Similarly, the statistical analysis conducted on geographies consisting of 472,851,475 people shows a poor positive correlation between the proportion of Immigrants from South Central Asia and labor force participation rate among population between the ages 25 and 29 in the United States with a correlation coefficient (R) of 0.162 and weighted average of 85.2%, a difference of 2.0%.
In Labor Force | Age 25-29 Correlation Summary
| Measurement | Immigrants from Fiji | Immigrants from South Central Asia |
| Minimum | 72.3% | 65.2% |
| Maximum | 91.7% | 100.0% |
| Range | 19.4% | 34.8% |
| Mean | 82.8% | 86.1% |
| Median | 83.9% | 86.0% |
| Interquartile 25% (IQ1) | 81.1% | 83.7% |
| Interquartile 75% (IQ3) | 84.4% | 87.5% |
| Interquartile Range (IQR) | 3.3% | 3.7% |
| Standard Deviation (Sample) | 3.9% | 5.3% |
| Standard Deviation (Population) | 3.8% | 5.3% |
Similar Demographics by In Labor Force | Age 25-29
Demographics Similar to Immigrants from Fiji by In Labor Force | Age 25-29
In terms of in labor force | age 25-29, the demographic groups most similar to Immigrants from Fiji are West Indian (83.5%, a difference of 0.040%), Pennsylvania German (83.6%, a difference of 0.060%), Immigrants from Bahamas (83.6%, a difference of 0.070%), Immigrants from Guatemala (83.6%, a difference of 0.080%), and Spanish (83.6%, a difference of 0.080%).
| Demographics | Rating | Rank | In Labor Force | Age 25-29 |
| Haitians | 0.2 /100 | #255 | Tragic 83.7% |
| Immigrants | Haiti | 0.2 /100 | #256 | Tragic 83.7% |
| Delaware | 0.2 /100 | #257 | Tragic 83.7% |
| Immigrants | Guatemala | 0.1 /100 | #258 | Tragic 83.6% |
| Spanish | 0.1 /100 | #259 | Tragic 83.6% |
| Immigrants | Bahamas | 0.1 /100 | #260 | Tragic 83.6% |
| Pennsylvania Germans | 0.1 /100 | #261 | Tragic 83.6% |
| Immigrants | Fiji | 0.1 /100 | #262 | Tragic 83.6% |
| West Indians | 0.1 /100 | #263 | Tragic 83.5% |
| Puget Sound Salish | 0.1 /100 | #264 | Tragic 83.5% |
| Cubans | 0.1 /100 | #265 | Tragic 83.5% |
| Aleuts | 0.0 /100 | #266 | Tragic 83.4% |
| Spanish Americans | 0.0 /100 | #267 | Tragic 83.4% |
| Immigrants | Lebanon | 0.0 /100 | #268 | Tragic 83.4% |
| Immigrants | Barbados | 0.0 /100 | #269 | Tragic 83.4% |
Demographics Similar to Immigrants from South Central Asia by In Labor Force | Age 25-29
In terms of in labor force | age 25-29, the demographic groups most similar to Immigrants from South Central Asia are German (85.3%, a difference of 0.020%), Immigrants from Egypt (85.2%, a difference of 0.020%), Immigrants from Northern Africa (85.2%, a difference of 0.020%), Immigrants from Zimbabwe (85.2%, a difference of 0.030%), and Brazilian (85.3%, a difference of 0.040%).
| Demographics | Rating | Rank | In Labor Force | Age 25-29 |
| Immigrants | Sweden | 99.1 /100 | #70 | Exceptional 85.4% |
| Kenyans | 99.0 /100 | #71 | Exceptional 85.4% |
| Immigrants | Australia | 98.9 /100 | #72 | Exceptional 85.3% |
| Russians | 98.8 /100 | #73 | Exceptional 85.3% |
| Soviet Union | 98.5 /100 | #74 | Exceptional 85.3% |
| Brazilians | 98.3 /100 | #75 | Exceptional 85.3% |
| Germans | 98.1 /100 | #76 | Exceptional 85.3% |
| Immigrants | South Central Asia | 97.9 /100 | #77 | Exceptional 85.2% |
| Immigrants | Egypt | 97.7 /100 | #78 | Exceptional 85.2% |
| Immigrants | Northern Africa | 97.6 /100 | #79 | Exceptional 85.2% |
| Immigrants | Zimbabwe | 97.6 /100 | #80 | Exceptional 85.2% |
| Immigrants | Northern Europe | 97.2 /100 | #81 | Exceptional 85.2% |
| Okinawans | 97.0 /100 | #82 | Exceptional 85.2% |
| Immigrants | Europe | 96.8 /100 | #83 | Exceptional 85.2% |
| Immigrants | Eastern Europe | 96.8 /100 | #84 | Exceptional 85.2% |