Lithuanian vs Immigrants from South Central Asia In Labor Force | Age 25-29
COMPARE
Lithuanian
Immigrants from South Central Asia
In Labor Force | Age 25-29
In Labor Force | Age 25-29 Comparison
Lithuanians
Immigrants from South Central Asia
85.8%
IN LABOR FORCE | AGE 25-29
99.9/ 100
METRIC RATING
34th/ 347
METRIC RANK
85.2%
IN LABOR FORCE | AGE 25-29
97.9/ 100
METRIC RATING
77th/ 347
METRIC RANK
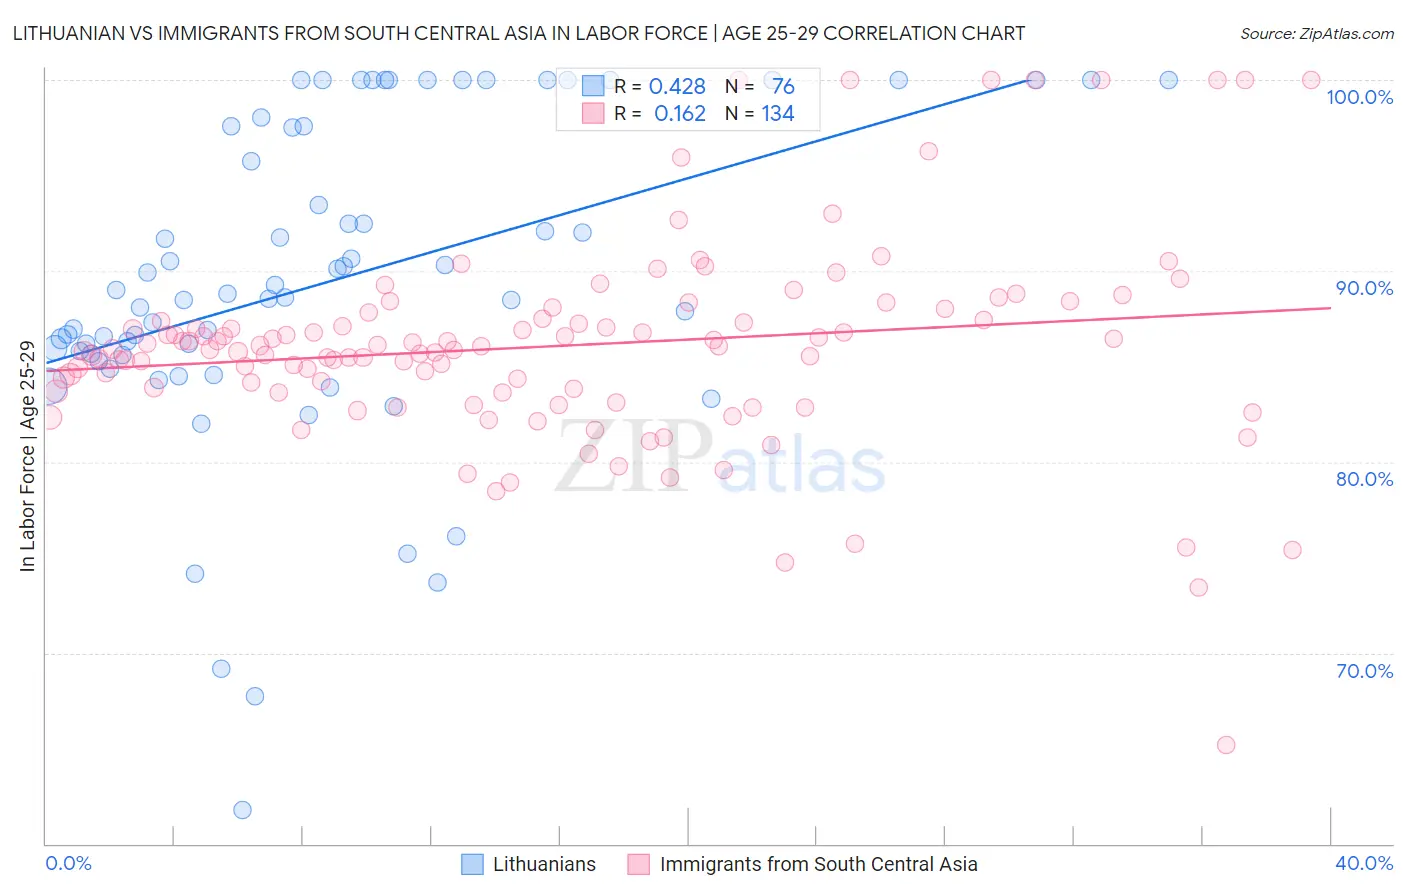
Lithuanian vs Immigrants from South Central Asia In Labor Force | Age 25-29 Correlation Chart
The statistical analysis conducted on geographies consisting of 421,659,157 people shows a moderate positive correlation between the proportion of Lithuanians and labor force participation rate among population between the ages 25 and 29 in the United States with a correlation coefficient (R) of 0.428 and weighted average of 85.8%. Similarly, the statistical analysis conducted on geographies consisting of 472,851,475 people shows a poor positive correlation between the proportion of Immigrants from South Central Asia and labor force participation rate among population between the ages 25 and 29 in the United States with a correlation coefficient (R) of 0.162 and weighted average of 85.2%, a difference of 0.66%.
In Labor Force | Age 25-29 Correlation Summary
| Measurement | Lithuanian | Immigrants from South Central Asia |
| Minimum | 61.7% | 65.2% |
| Maximum | 100.0% | 100.0% |
| Range | 38.3% | 34.8% |
| Mean | 89.5% | 86.1% |
| Median | 88.7% | 86.0% |
| Interquartile 25% (IQ1) | 85.6% | 83.7% |
| Interquartile 75% (IQ3) | 97.6% | 87.5% |
| Interquartile Range (IQR) | 11.9% | 3.7% |
| Standard Deviation (Sample) | 8.4% | 5.3% |
| Standard Deviation (Population) | 8.3% | 5.3% |
Similar Demographics by In Labor Force | Age 25-29
Demographics Similar to Lithuanians by In Labor Force | Age 25-29
In terms of in labor force | age 25-29, the demographic groups most similar to Lithuanians are Cypriot (85.8%, a difference of 0.010%), Immigrants from Nepal (85.8%, a difference of 0.010%), German Russian (85.8%, a difference of 0.030%), Slovak (85.8%, a difference of 0.030%), and Immigrants from Bulgaria (85.8%, a difference of 0.030%).
| Demographics | Rating | Rank | In Labor Force | Age 25-29 |
| Paraguayans | 100.0 /100 | #27 | Exceptional 85.9% |
| Ugandans | 100.0 /100 | #28 | Exceptional 85.9% |
| Immigrants | Liberia | 100.0 /100 | #29 | Exceptional 85.9% |
| Immigrants | Serbia | 100.0 /100 | #30 | Exceptional 85.9% |
| German Russians | 100.0 /100 | #31 | Exceptional 85.8% |
| Slovaks | 100.0 /100 | #32 | Exceptional 85.8% |
| Immigrants | Bulgaria | 100.0 /100 | #33 | Exceptional 85.8% |
| Lithuanians | 99.9 /100 | #34 | Exceptional 85.8% |
| Cypriots | 99.9 /100 | #35 | Exceptional 85.8% |
| Immigrants | Nepal | 99.9 /100 | #36 | Exceptional 85.8% |
| Poles | 99.9 /100 | #37 | Exceptional 85.8% |
| Sierra Leoneans | 99.9 /100 | #38 | Exceptional 85.8% |
| Croatians | 99.9 /100 | #39 | Exceptional 85.8% |
| Immigrants | Albania | 99.9 /100 | #40 | Exceptional 85.7% |
| Immigrants | Greece | 99.9 /100 | #41 | Exceptional 85.7% |
Demographics Similar to Immigrants from South Central Asia by In Labor Force | Age 25-29
In terms of in labor force | age 25-29, the demographic groups most similar to Immigrants from South Central Asia are German (85.3%, a difference of 0.020%), Immigrants from Egypt (85.2%, a difference of 0.020%), Immigrants from Northern Africa (85.2%, a difference of 0.020%), Immigrants from Zimbabwe (85.2%, a difference of 0.030%), and Brazilian (85.3%, a difference of 0.040%).
| Demographics | Rating | Rank | In Labor Force | Age 25-29 |
| Immigrants | Sweden | 99.1 /100 | #70 | Exceptional 85.4% |
| Kenyans | 99.0 /100 | #71 | Exceptional 85.4% |
| Immigrants | Australia | 98.9 /100 | #72 | Exceptional 85.3% |
| Russians | 98.8 /100 | #73 | Exceptional 85.3% |
| Soviet Union | 98.5 /100 | #74 | Exceptional 85.3% |
| Brazilians | 98.3 /100 | #75 | Exceptional 85.3% |
| Germans | 98.1 /100 | #76 | Exceptional 85.3% |
| Immigrants | South Central Asia | 97.9 /100 | #77 | Exceptional 85.2% |
| Immigrants | Egypt | 97.7 /100 | #78 | Exceptional 85.2% |
| Immigrants | Northern Africa | 97.6 /100 | #79 | Exceptional 85.2% |
| Immigrants | Zimbabwe | 97.6 /100 | #80 | Exceptional 85.2% |
| Immigrants | Northern Europe | 97.2 /100 | #81 | Exceptional 85.2% |
| Okinawans | 97.0 /100 | #82 | Exceptional 85.2% |
| Immigrants | Europe | 96.8 /100 | #83 | Exceptional 85.2% |
| Immigrants | Eastern Europe | 96.8 /100 | #84 | Exceptional 85.2% |