Cheyenne vs Immigrants from Western Asia In Labor Force | Age 45-54
COMPARE
Cheyenne
Immigrants from Western Asia
In Labor Force | Age 45-54
In Labor Force | Age 45-54 Comparison
Cheyenne
Immigrants from Western Asia
77.6%
IN LABOR FORCE | AGE 45-54
0.0/ 100
METRIC RATING
330th/ 347
METRIC RANK
82.4%
IN LABOR FORCE | AGE 45-54
14.9/ 100
METRIC RATING
202nd/ 347
METRIC RANK
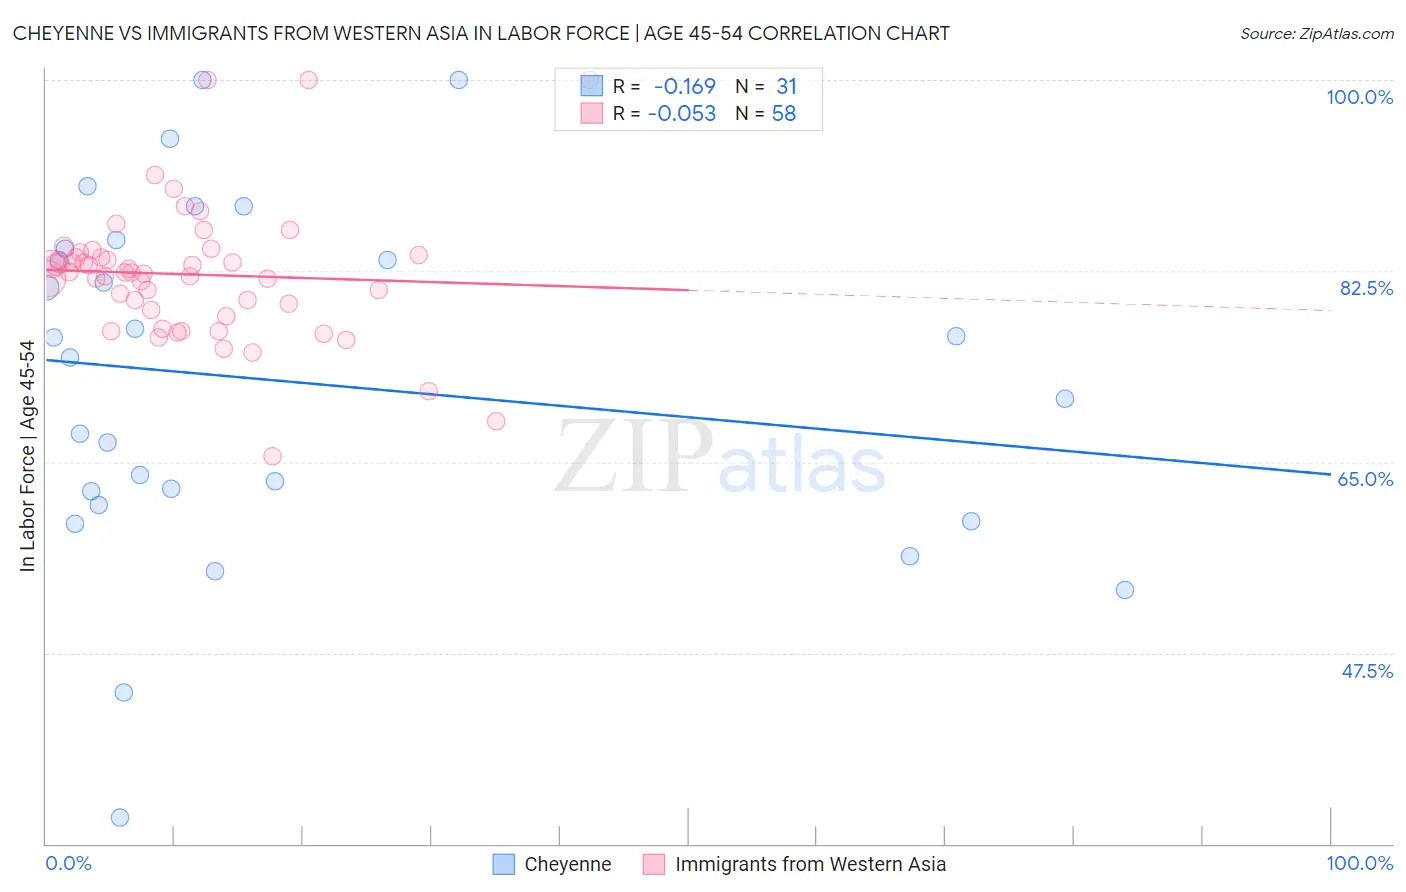
Cheyenne vs Immigrants from Western Asia In Labor Force | Age 45-54 Correlation Chart
The statistical analysis conducted on geographies consisting of 80,704,185 people shows a poor negative correlation between the proportion of Cheyenne and labor force participation rate among population between the ages 45 and 54 in the United States with a correlation coefficient (R) of -0.169 and weighted average of 77.6%. Similarly, the statistical analysis conducted on geographies consisting of 404,107,591 people shows a slight negative correlation between the proportion of Immigrants from Western Asia and labor force participation rate among population between the ages 45 and 54 in the United States with a correlation coefficient (R) of -0.053 and weighted average of 82.4%, a difference of 6.3%.
In Labor Force | Age 45-54 Correlation Summary
| Measurement | Cheyenne | Immigrants from Western Asia |
| Minimum | 32.4% | 65.6% |
| Maximum | 100.0% | 100.0% |
| Range | 67.6% | 34.4% |
| Mean | 72.4% | 82.2% |
| Median | 74.5% | 82.4% |
| Interquartile 25% (IQ1) | 61.0% | 78.9% |
| Interquartile 75% (IQ3) | 84.5% | 84.0% |
| Interquartile Range (IQR) | 23.5% | 5.1% |
| Standard Deviation (Sample) | 16.2% | 6.2% |
| Standard Deviation (Population) | 15.9% | 6.2% |
Similar Demographics by In Labor Force | Age 45-54
Demographics Similar to Cheyenne by In Labor Force | Age 45-54
In terms of in labor force | age 45-54, the demographic groups most similar to Cheyenne are Tsimshian (77.4%, a difference of 0.15%), Menominee (77.4%, a difference of 0.18%), Creek (77.7%, a difference of 0.22%), Sioux (78.0%, a difference of 0.52%), and Native/Alaskan (77.1%, a difference of 0.54%).
| Demographics | Rating | Rank | In Labor Force | Age 45-54 |
| Kiowa | 0.0 /100 | #323 | Tragic 78.3% |
| Dutch West Indians | 0.0 /100 | #324 | Tragic 78.2% |
| Choctaw | 0.0 /100 | #325 | Tragic 78.2% |
| Seminole | 0.0 /100 | #326 | Tragic 78.1% |
| Cajuns | 0.0 /100 | #327 | Tragic 78.1% |
| Sioux | 0.0 /100 | #328 | Tragic 78.0% |
| Creek | 0.0 /100 | #329 | Tragic 77.7% |
| Cheyenne | 0.0 /100 | #330 | Tragic 77.6% |
| Tsimshian | 0.0 /100 | #331 | Tragic 77.4% |
| Menominee | 0.0 /100 | #332 | Tragic 77.4% |
| Natives/Alaskans | 0.0 /100 | #333 | Tragic 77.1% |
| Apache | 0.0 /100 | #334 | Tragic 77.1% |
| Arapaho | 0.0 /100 | #335 | Tragic 77.1% |
| Paiute | 0.0 /100 | #336 | Tragic 76.7% |
| Ute | 0.0 /100 | #337 | Tragic 76.6% |
Demographics Similar to Immigrants from Western Asia by In Labor Force | Age 45-54
In terms of in labor force | age 45-54, the demographic groups most similar to Immigrants from Western Asia are Canadian (82.4%, a difference of 0.0%), Moroccan (82.5%, a difference of 0.010%), French Canadian (82.5%, a difference of 0.010%), Lebanese (82.5%, a difference of 0.050%), and Immigrants from Denmark (82.5%, a difference of 0.050%).
| Demographics | Rating | Rank | In Labor Force | Age 45-54 |
| Immigrants | Canada | 20.0 /100 | #195 | Fair 82.5% |
| Immigrants | North America | 18.8 /100 | #196 | Poor 82.5% |
| Lebanese | 18.2 /100 | #197 | Poor 82.5% |
| Immigrants | Denmark | 17.9 /100 | #198 | Poor 82.5% |
| Moroccans | 15.7 /100 | #199 | Poor 82.5% |
| French Canadians | 15.4 /100 | #200 | Poor 82.5% |
| Canadians | 15.1 /100 | #201 | Poor 82.4% |
| Immigrants | Western Asia | 14.9 /100 | #202 | Poor 82.4% |
| Arabs | 11.6 /100 | #203 | Poor 82.4% |
| Immigrants | Western Europe | 10.9 /100 | #204 | Poor 82.4% |
| Senegalese | 9.5 /100 | #205 | Tragic 82.4% |
| Welsh | 9.2 /100 | #206 | Tragic 82.3% |
| Immigrants | Cabo Verde | 8.6 /100 | #207 | Tragic 82.3% |
| Native Hawaiians | 8.5 /100 | #208 | Tragic 82.3% |
| Immigrants | Lebanon | 7.4 /100 | #209 | Tragic 82.3% |