Cheyenne vs Thai Unemployment Among Women with Children Under 18 years
COMPARE
Cheyenne
Thai
Unemployment Among Women with Children Under 18 years
Unemployment Among Women with Children Under 18 years Comparison
Cheyenne
Thais
7.8%
UNEMPLOYMENT AMONG WOMEN WITH CHILDREN UNDER 18 YEARS
0.0/ 100
METRIC RATING
334th/ 347
METRIC RANK
4.8%
UNEMPLOYMENT AMONG WOMEN WITH CHILDREN UNDER 18 YEARS
99.8/ 100
METRIC RATING
15th/ 347
METRIC RANK
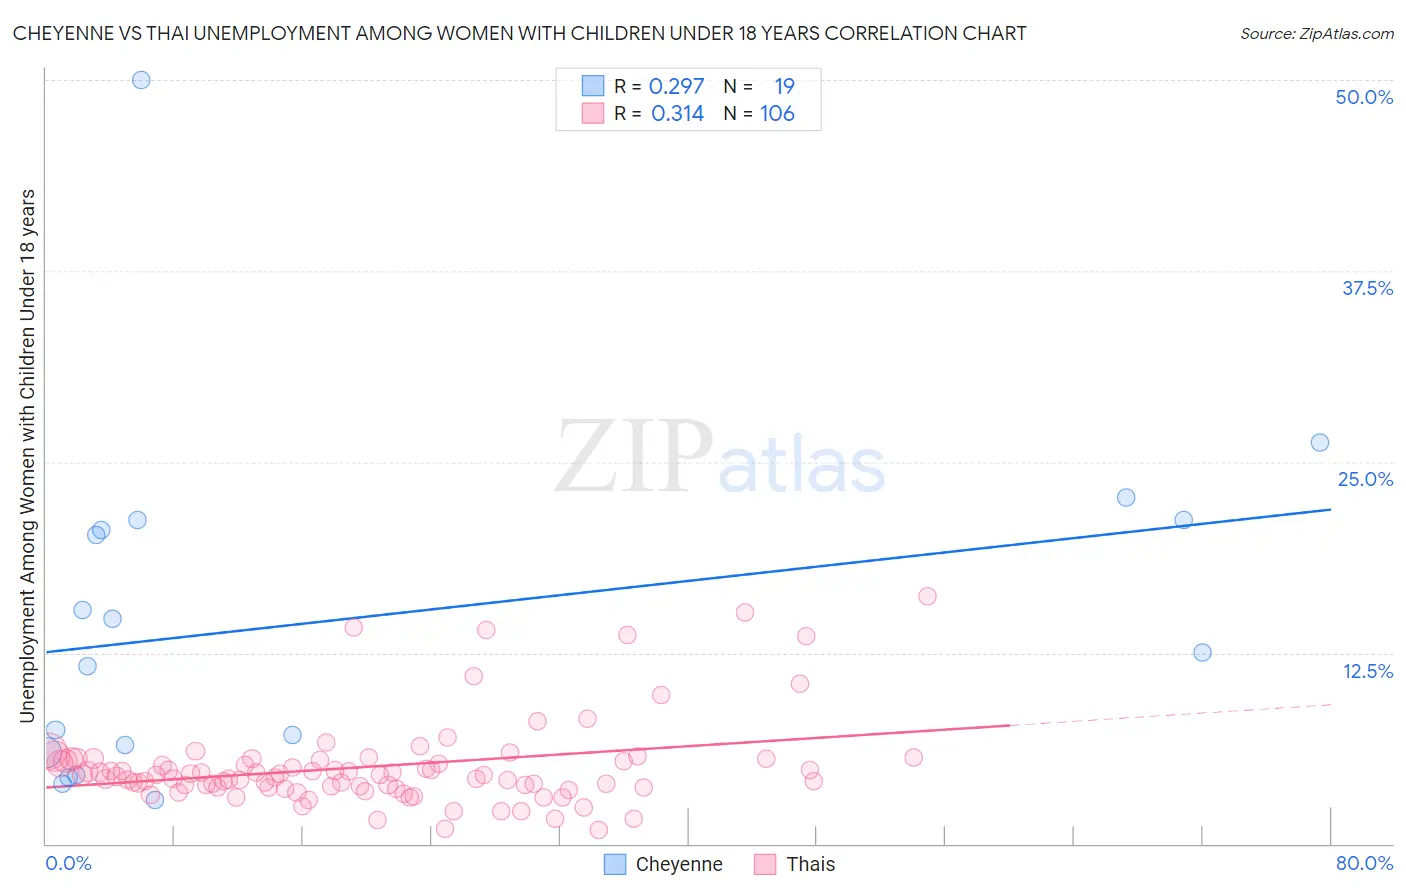
Cheyenne vs Thai Unemployment Among Women with Children Under 18 years Correlation Chart
The statistical analysis conducted on geographies consisting of 79,481,561 people shows a weak positive correlation between the proportion of Cheyenne and unemployment rate among women with children under the age of 18 in the United States with a correlation coefficient (R) of 0.297 and weighted average of 7.8%. Similarly, the statistical analysis conducted on geographies consisting of 452,734,115 people shows a mild positive correlation between the proportion of Thais and unemployment rate among women with children under the age of 18 in the United States with a correlation coefficient (R) of 0.314 and weighted average of 4.8%, a difference of 62.6%.
Unemployment Among Women with Children Under 18 years Correlation Summary
| Measurement | Cheyenne | Thai |
| Minimum | 2.9% | 0.90% |
| Maximum | 50.0% | 16.2% |
| Range | 47.1% | 15.3% |
| Mean | 14.7% | 5.0% |
| Median | 12.5% | 4.5% |
| Interquartile 25% (IQ1) | 6.0% | 3.7% |
| Interquartile 75% (IQ3) | 21.2% | 5.5% |
| Interquartile Range (IQR) | 15.2% | 1.8% |
| Standard Deviation (Sample) | 11.4% | 2.8% |
| Standard Deviation (Population) | 11.1% | 2.8% |
Similar Demographics by Unemployment Among Women with Children Under 18 years
Demographics Similar to Cheyenne by Unemployment Among Women with Children Under 18 years
In terms of unemployment among women with children under 18 years, the demographic groups most similar to Cheyenne are Apache (7.9%, a difference of 0.98%), Sioux (7.9%, a difference of 1.3%), Yakama (8.1%, a difference of 2.7%), Immigrants from Yemen (8.2%, a difference of 4.4%), and Immigrants from Dominican Republic (7.5%, a difference of 4.6%).
| Demographics | Rating | Rank | Unemployment Among Women with Children Under 18 years |
| Lumbee | 0.0 /100 | #327 | Tragic 7.1% |
| Natives/Alaskans | 0.0 /100 | #328 | Tragic 7.2% |
| Blacks/African Americans | 0.0 /100 | #329 | Tragic 7.3% |
| Colville | 0.0 /100 | #330 | Tragic 7.4% |
| Hopi | 0.0 /100 | #331 | Tragic 7.4% |
| Dominicans | 0.0 /100 | #332 | Tragic 7.5% |
| Immigrants | Dominican Republic | 0.0 /100 | #333 | Tragic 7.5% |
| Cheyenne | 0.0 /100 | #334 | Tragic 7.8% |
| Apache | 0.0 /100 | #335 | Tragic 7.9% |
| Sioux | 0.0 /100 | #336 | Tragic 7.9% |
| Yakama | 0.0 /100 | #337 | Tragic 8.1% |
| Immigrants | Yemen | 0.0 /100 | #338 | Tragic 8.2% |
| Navajo | 0.0 /100 | #339 | Tragic 8.2% |
| Crow | 0.0 /100 | #340 | Tragic 8.2% |
| Tohono O'odham | 0.0 /100 | #341 | Tragic 8.9% |
Demographics Similar to Thais by Unemployment Among Women with Children Under 18 years
In terms of unemployment among women with children under 18 years, the demographic groups most similar to Thais are Cambodian (4.8%, a difference of 0.16%), Taiwanese (4.8%, a difference of 0.46%), Bulgarian (4.8%, a difference of 0.51%), Immigrants from Singapore (4.9%, a difference of 0.66%), and Slovene (4.9%, a difference of 0.77%).
| Demographics | Rating | Rank | Unemployment Among Women with Children Under 18 years |
| Immigrants | Hong Kong | 100.0 /100 | #8 | Exceptional 4.7% |
| Okinawans | 99.9 /100 | #9 | Exceptional 4.7% |
| Czechs | 99.9 /100 | #10 | Exceptional 4.7% |
| Filipinos | 99.9 /100 | #11 | Exceptional 4.8% |
| Scandinavians | 99.9 /100 | #12 | Exceptional 4.8% |
| Bulgarians | 99.9 /100 | #13 | Exceptional 4.8% |
| Cambodians | 99.9 /100 | #14 | Exceptional 4.8% |
| Thais | 99.8 /100 | #15 | Exceptional 4.8% |
| Taiwanese | 99.8 /100 | #16 | Exceptional 4.8% |
| Immigrants | Singapore | 99.8 /100 | #17 | Exceptional 4.9% |
| Slovenes | 99.8 /100 | #18 | Exceptional 4.9% |
| Germans | 99.8 /100 | #19 | Exceptional 4.9% |
| Latvians | 99.7 /100 | #20 | Exceptional 4.9% |
| Europeans | 99.6 /100 | #21 | Exceptional 4.9% |
| Indians (Asian) | 99.6 /100 | #22 | Exceptional 4.9% |