Cheyenne vs Inupiat Householder Income Ages 45 - 64 years
COMPARE
Cheyenne
Inupiat
Householder Income Ages 45 - 64 years
Householder Income Ages 45 - 64 years Comparison
Cheyenne
Inupiat
$76,362
HOUSEHOLDER INCOME AGES 45 - 64 YEARS
0.0/ 100
METRIC RATING
335th/ 347
METRIC RANK
$91,355
HOUSEHOLDER INCOME AGES 45 - 64 YEARS
1.1/ 100
METRIC RATING
242nd/ 347
METRIC RANK
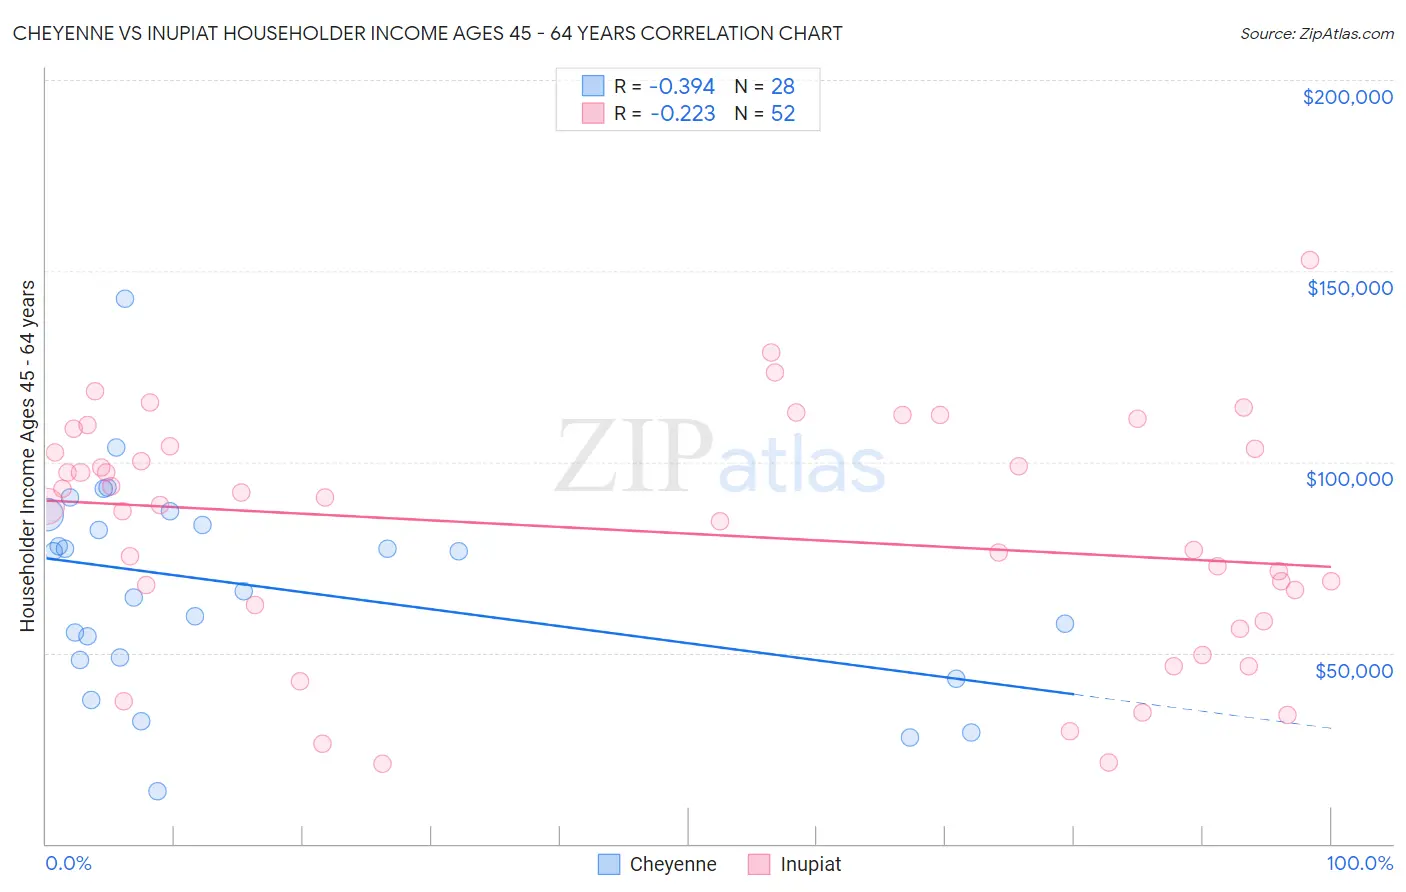
Cheyenne vs Inupiat Householder Income Ages 45 - 64 years Correlation Chart
The statistical analysis conducted on geographies consisting of 80,666,716 people shows a mild negative correlation between the proportion of Cheyenne and household income with householder between the ages 45 and 64 in the United States with a correlation coefficient (R) of -0.394 and weighted average of $76,362. Similarly, the statistical analysis conducted on geographies consisting of 96,273,732 people shows a weak negative correlation between the proportion of Inupiat and household income with householder between the ages 45 and 64 in the United States with a correlation coefficient (R) of -0.223 and weighted average of $91,355, a difference of 19.6%.
Householder Income Ages 45 - 64 years Correlation Summary
| Measurement | Cheyenne | Inupiat |
| Minimum | $13,750 | $20,833 |
| Maximum | $142,727 | $152,917 |
| Range | $128,977 | $132,084 |
| Mean | $67,332 | $81,669 |
| Median | $71,250 | $88,444 |
| Interquartile 25% (IQ1) | $48,460 | $60,416 |
| Interquartile 75% (IQ3) | $84,816 | $103,725 |
| Interquartile Range (IQR) | $36,356 | $43,309 |
| Standard Deviation (Sample) | $27,465 | $30,923 |
| Standard Deviation (Population) | $26,970 | $30,625 |
Similar Demographics by Householder Income Ages 45 - 64 years
Demographics Similar to Cheyenne by Householder Income Ages 45 - 64 years
In terms of householder income ages 45 - 64 years, the demographic groups most similar to Cheyenne are Arapaho ($75,945, a difference of 0.55%), Menominee ($76,903, a difference of 0.71%), Pueblo ($75,601, a difference of 1.0%), Hopi ($75,562, a difference of 1.1%), and Immigrants from Congo ($77,850, a difference of 1.9%).
| Demographics | Rating | Rank | Householder Income Ages 45 - 64 years |
| Natives/Alaskans | 0.0 /100 | #328 | Tragic $79,816 |
| Dutch West Indians | 0.0 /100 | #329 | Tragic $79,171 |
| Creek | 0.0 /100 | #330 | Tragic $78,960 |
| Immigrants | Dominican Republic | 0.0 /100 | #331 | Tragic $78,836 |
| Blacks/African Americans | 0.0 /100 | #332 | Tragic $78,556 |
| Immigrants | Congo | 0.0 /100 | #333 | Tragic $77,850 |
| Menominee | 0.0 /100 | #334 | Tragic $76,903 |
| Cheyenne | 0.0 /100 | #335 | Tragic $76,362 |
| Arapaho | 0.0 /100 | #336 | Tragic $75,945 |
| Pueblo | 0.0 /100 | #337 | Tragic $75,601 |
| Hopi | 0.0 /100 | #338 | Tragic $75,562 |
| Kiowa | 0.0 /100 | #339 | Tragic $74,815 |
| Immigrants | Yemen | 0.0 /100 | #340 | Tragic $74,575 |
| Crow | 0.0 /100 | #341 | Tragic $74,257 |
| Tohono O'odham | 0.0 /100 | #342 | Tragic $73,774 |
Demographics Similar to Inupiat by Householder Income Ages 45 - 64 years
In terms of householder income ages 45 - 64 years, the demographic groups most similar to Inupiat are Trinidadian and Tobagonian ($91,357, a difference of 0.0%), Immigrants from Trinidad and Tobago ($91,347, a difference of 0.010%), Immigrants from Burma/Myanmar ($91,385, a difference of 0.030%), Immigrants from Middle Africa ($91,293, a difference of 0.070%), and Immigrants from Ecuador ($91,462, a difference of 0.12%).
| Demographics | Rating | Rank | Householder Income Ages 45 - 64 years |
| Nicaraguans | 2.0 /100 | #235 | Tragic $92,554 |
| Immigrants | Western Africa | 1.8 /100 | #236 | Tragic $92,384 |
| Immigrants | Bangladesh | 1.7 /100 | #237 | Tragic $92,208 |
| Pennsylvania Germans | 1.5 /100 | #238 | Tragic $91,956 |
| Immigrants | Ecuador | 1.2 /100 | #239 | Tragic $91,462 |
| Immigrants | Burma/Myanmar | 1.1 /100 | #240 | Tragic $91,385 |
| Trinidadians and Tobagonians | 1.1 /100 | #241 | Tragic $91,357 |
| Inupiat | 1.1 /100 | #242 | Tragic $91,355 |
| Immigrants | Trinidad and Tobago | 1.1 /100 | #243 | Tragic $91,347 |
| Immigrants | Middle Africa | 1.1 /100 | #244 | Tragic $91,293 |
| Guyanese | 0.9 /100 | #245 | Tragic $90,966 |
| Central Americans | 0.9 /100 | #246 | Tragic $90,951 |
| Alaskan Athabascans | 0.9 /100 | #247 | Tragic $90,951 |
| Immigrants | Laos | 0.9 /100 | #248 | Tragic $90,909 |
| Mexican American Indians | 0.8 /100 | #249 | Tragic $90,811 |