Australian vs Immigrants from Chile In Labor Force | Age 20-24
COMPARE
Australian
Immigrants from Chile
In Labor Force | Age 20-24
In Labor Force | Age 20-24 Comparison
Australians
Immigrants from Chile
75.5%
IN LABOR FORCE | AGE 20-24
84.8/ 100
METRIC RATING
138th/ 347
METRIC RANK
74.1%
IN LABOR FORCE | AGE 20-24
3.7/ 100
METRIC RATING
233rd/ 347
METRIC RANK
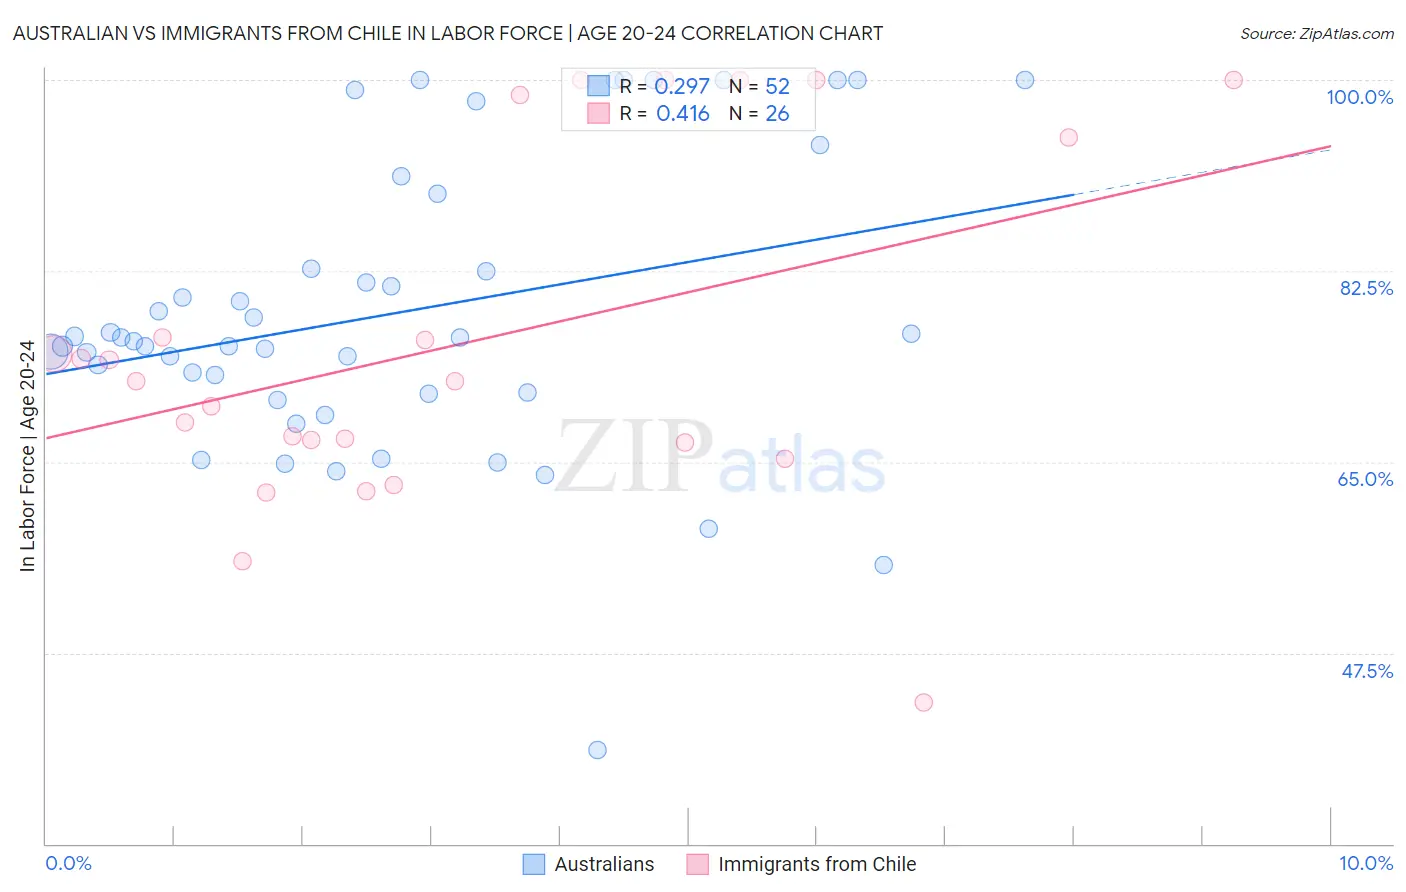
Australian vs Immigrants from Chile In Labor Force | Age 20-24 Correlation Chart
The statistical analysis conducted on geographies consisting of 224,080,668 people shows a weak positive correlation between the proportion of Australians and labor force participation rate among population between the ages 20 and 24 in the United States with a correlation coefficient (R) of 0.297 and weighted average of 75.5%. Similarly, the statistical analysis conducted on geographies consisting of 218,628,779 people shows a moderate positive correlation between the proportion of Immigrants from Chile and labor force participation rate among population between the ages 20 and 24 in the United States with a correlation coefficient (R) of 0.416 and weighted average of 74.1%, a difference of 1.8%.
In Labor Force | Age 20-24 Correlation Summary
| Measurement | Australian | Immigrants from Chile |
| Minimum | 38.6% | 42.9% |
| Maximum | 100.0% | 100.0% |
| Range | 61.4% | 57.1% |
| Mean | 78.6% | 75.9% |
| Median | 76.2% | 72.4% |
| Interquartile 25% (IQ1) | 71.3% | 66.8% |
| Interquartile 75% (IQ3) | 86.1% | 94.7% |
| Interquartile Range (IQR) | 14.8% | 27.9% |
| Standard Deviation (Sample) | 13.5% | 15.9% |
| Standard Deviation (Population) | 13.3% | 15.6% |
Similar Demographics by In Labor Force | Age 20-24
Demographics Similar to Australians by In Labor Force | Age 20-24
In terms of in labor force | age 20-24, the demographic groups most similar to Australians are Immigrants from Brazil (75.5%, a difference of 0.0%), Jordanian (75.5%, a difference of 0.0%), Immigrants from England (75.5%, a difference of 0.010%), Delaware (75.5%, a difference of 0.010%), and Yaqui (75.5%, a difference of 0.020%).
| Demographics | Rating | Rank | In Labor Force | Age 20-24 |
| Immigrants | Jordan | 88.5 /100 | #131 | Excellent 75.6% |
| Palestinians | 88.4 /100 | #132 | Excellent 75.6% |
| Zimbabweans | 88.2 /100 | #133 | Excellent 75.6% |
| Estonians | 87.1 /100 | #134 | Excellent 75.6% |
| Yaqui | 85.5 /100 | #135 | Excellent 75.5% |
| Immigrants | Brazil | 84.8 /100 | #136 | Excellent 75.5% |
| Jordanians | 84.8 /100 | #137 | Excellent 75.5% |
| Australians | 84.8 /100 | #138 | Excellent 75.5% |
| Immigrants | England | 84.6 /100 | #139 | Excellent 75.5% |
| Delaware | 84.5 /100 | #140 | Excellent 75.5% |
| Romanians | 84.1 /100 | #141 | Excellent 75.5% |
| Blackfeet | 83.6 /100 | #142 | Excellent 75.5% |
| Spaniards | 82.0 /100 | #143 | Excellent 75.5% |
| Bhutanese | 80.8 /100 | #144 | Excellent 75.4% |
| Koreans | 79.7 /100 | #145 | Good 75.4% |
Demographics Similar to Immigrants from Chile by In Labor Force | Age 20-24
In terms of in labor force | age 20-24, the demographic groups most similar to Immigrants from Chile are Immigrants (74.1%, a difference of 0.010%), Laotian (74.1%, a difference of 0.020%), Immigrants from Switzerland (74.2%, a difference of 0.040%), Immigrants from France (74.1%, a difference of 0.040%), and Immigrants from Greece (74.2%, a difference of 0.050%).
| Demographics | Rating | Rank | In Labor Force | Age 20-24 |
| Immigrants | Fiji | 5.9 /100 | #226 | Tragic 74.3% |
| Immigrants | Ireland | 5.8 /100 | #227 | Tragic 74.3% |
| Immigrants | Ukraine | 5.1 /100 | #228 | Tragic 74.2% |
| Immigrants | Sweden | 4.6 /100 | #229 | Tragic 74.2% |
| Immigrants | Albania | 4.3 /100 | #230 | Tragic 74.2% |
| Immigrants | Greece | 4.1 /100 | #231 | Tragic 74.2% |
| Immigrants | Switzerland | 4.1 /100 | #232 | Tragic 74.2% |
| Immigrants | Chile | 3.7 /100 | #233 | Tragic 74.1% |
| Immigrants | Immigrants | 3.6 /100 | #234 | Tragic 74.1% |
| Laotians | 3.5 /100 | #235 | Tragic 74.1% |
| Immigrants | France | 3.3 /100 | #236 | Tragic 74.1% |
| Bermudans | 3.2 /100 | #237 | Tragic 74.1% |
| Immigrants | Japan | 3.0 /100 | #238 | Tragic 74.1% |
| Immigrants | Latin America | 2.7 /100 | #239 | Tragic 74.1% |
| Immigrants | Sri Lanka | 2.3 /100 | #240 | Tragic 74.0% |