Immigrants from Oceania vs Immigrants from Chile In Labor Force | Age 20-24
COMPARE
Immigrants from Oceania
Immigrants from Chile
In Labor Force | Age 20-24
In Labor Force | Age 20-24 Comparison
Immigrants from Oceania
Immigrants from Chile
76.1%
IN LABOR FORCE | AGE 20-24
98.0/ 100
METRIC RATING
98th/ 347
METRIC RANK
74.1%
IN LABOR FORCE | AGE 20-24
3.7/ 100
METRIC RATING
233rd/ 347
METRIC RANK
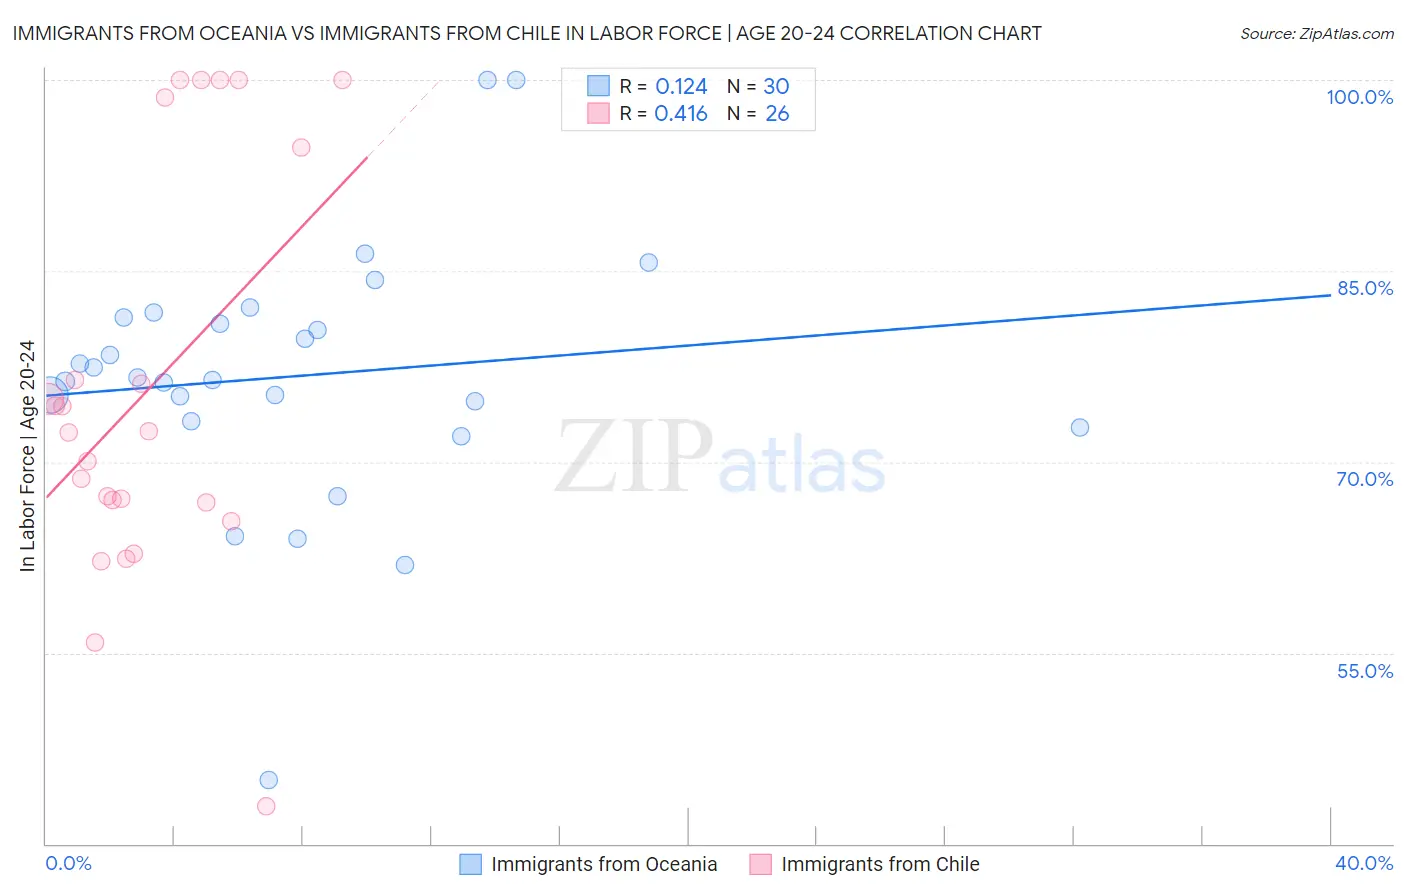
Immigrants from Oceania vs Immigrants from Chile In Labor Force | Age 20-24 Correlation Chart
The statistical analysis conducted on geographies consisting of 305,402,520 people shows a poor positive correlation between the proportion of Immigrants from Oceania and labor force participation rate among population between the ages 20 and 24 in the United States with a correlation coefficient (R) of 0.124 and weighted average of 76.1%. Similarly, the statistical analysis conducted on geographies consisting of 218,628,779 people shows a moderate positive correlation between the proportion of Immigrants from Chile and labor force participation rate among population between the ages 20 and 24 in the United States with a correlation coefficient (R) of 0.416 and weighted average of 74.1%, a difference of 2.6%.
In Labor Force | Age 20-24 Correlation Summary
| Measurement | Immigrants from Oceania | Immigrants from Chile |
| Minimum | 45.0% | 42.9% |
| Maximum | 100.0% | 100.0% |
| Range | 55.0% | 57.1% |
| Mean | 76.7% | 75.9% |
| Median | 76.5% | 72.4% |
| Interquartile 25% (IQ1) | 73.2% | 66.8% |
| Interquartile 75% (IQ3) | 81.4% | 94.7% |
| Interquartile Range (IQR) | 8.2% | 27.9% |
| Standard Deviation (Sample) | 10.4% | 15.9% |
| Standard Deviation (Population) | 10.2% | 15.6% |
Similar Demographics by In Labor Force | Age 20-24
Demographics Similar to Immigrants from Oceania by In Labor Force | Age 20-24
In terms of in labor force | age 20-24, the demographic groups most similar to Immigrants from Oceania are Immigrants from Lithuania (76.1%, a difference of 0.0%), American (76.1%, a difference of 0.030%), Shoshone (76.1%, a difference of 0.040%), Immigrants from Poland (76.1%, a difference of 0.050%), and Latvian (76.1%, a difference of 0.060%).
| Demographics | Rating | Rank | In Labor Force | Age 20-24 |
| Sierra Leoneans | 99.0 /100 | #91 | Exceptional 76.3% |
| Maltese | 98.9 /100 | #92 | Exceptional 76.3% |
| Hungarians | 98.9 /100 | #93 | Exceptional 76.3% |
| Potawatomi | 98.5 /100 | #94 | Exceptional 76.2% |
| Immigrants | Germany | 98.5 /100 | #95 | Exceptional 76.2% |
| Immigrants | Nonimmigrants | 98.5 /100 | #96 | Exceptional 76.2% |
| Immigrants | Lithuania | 98.0 /100 | #97 | Exceptional 76.1% |
| Immigrants | Oceania | 98.0 /100 | #98 | Exceptional 76.1% |
| Americans | 97.8 /100 | #99 | Exceptional 76.1% |
| Shoshone | 97.8 /100 | #100 | Exceptional 76.1% |
| Immigrants | Poland | 97.7 /100 | #101 | Exceptional 76.1% |
| Latvians | 97.6 /100 | #102 | Exceptional 76.1% |
| Immigrants | North Macedonia | 97.5 /100 | #103 | Exceptional 76.1% |
| Macedonians | 97.2 /100 | #104 | Exceptional 76.0% |
| Immigrants | Nepal | 97.2 /100 | #105 | Exceptional 76.0% |
Demographics Similar to Immigrants from Chile by In Labor Force | Age 20-24
In terms of in labor force | age 20-24, the demographic groups most similar to Immigrants from Chile are Immigrants (74.1%, a difference of 0.010%), Laotian (74.1%, a difference of 0.020%), Immigrants from Switzerland (74.2%, a difference of 0.040%), Immigrants from France (74.1%, a difference of 0.040%), and Immigrants from Greece (74.2%, a difference of 0.050%).
| Demographics | Rating | Rank | In Labor Force | Age 20-24 |
| Immigrants | Fiji | 5.9 /100 | #226 | Tragic 74.3% |
| Immigrants | Ireland | 5.8 /100 | #227 | Tragic 74.3% |
| Immigrants | Ukraine | 5.1 /100 | #228 | Tragic 74.2% |
| Immigrants | Sweden | 4.6 /100 | #229 | Tragic 74.2% |
| Immigrants | Albania | 4.3 /100 | #230 | Tragic 74.2% |
| Immigrants | Greece | 4.1 /100 | #231 | Tragic 74.2% |
| Immigrants | Switzerland | 4.1 /100 | #232 | Tragic 74.2% |
| Immigrants | Chile | 3.7 /100 | #233 | Tragic 74.1% |
| Immigrants | Immigrants | 3.6 /100 | #234 | Tragic 74.1% |
| Laotians | 3.5 /100 | #235 | Tragic 74.1% |
| Immigrants | France | 3.3 /100 | #236 | Tragic 74.1% |
| Bermudans | 3.2 /100 | #237 | Tragic 74.1% |
| Immigrants | Japan | 3.0 /100 | #238 | Tragic 74.1% |
| Immigrants | Latin America | 2.7 /100 | #239 | Tragic 74.1% |
| Immigrants | Sri Lanka | 2.3 /100 | #240 | Tragic 74.0% |