Hawaiian vs Aleut In Labor Force | Age 45-54
COMPARE
Hawaiian
Aleut
In Labor Force | Age 45-54
In Labor Force | Age 45-54 Comparison
Hawaiians
Aleuts
81.5%
IN LABOR FORCE | AGE 45-54
0.1/ 100
METRIC RATING
261st/ 347
METRIC RANK
81.0%
IN LABOR FORCE | AGE 45-54
0.0/ 100
METRIC RATING
282nd/ 347
METRIC RANK
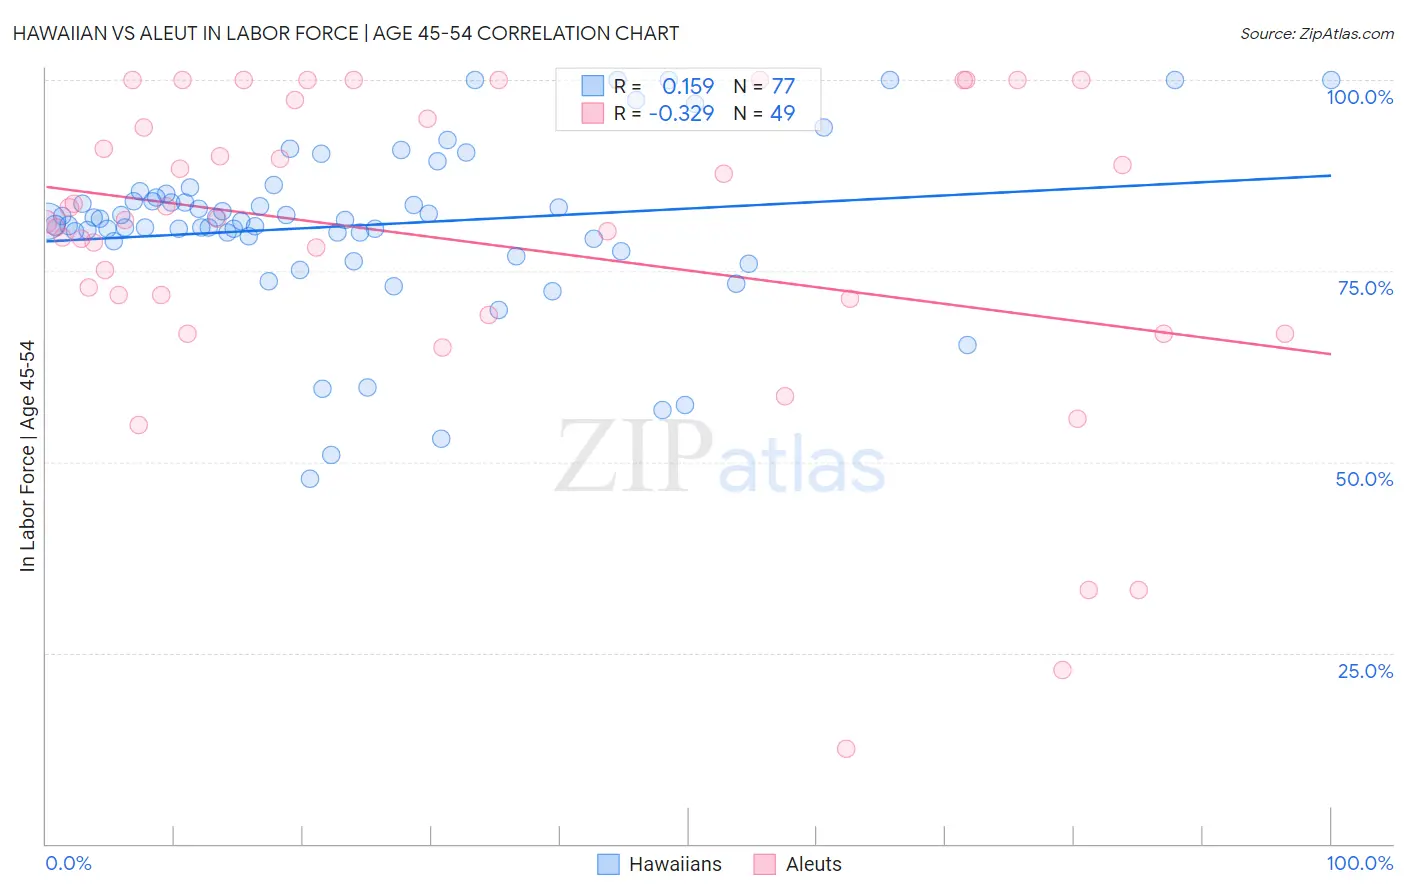
Hawaiian vs Aleut In Labor Force | Age 45-54 Correlation Chart
The statistical analysis conducted on geographies consisting of 327,376,409 people shows a poor positive correlation between the proportion of Hawaiians and labor force participation rate among population between the ages 45 and 54 in the United States with a correlation coefficient (R) of 0.159 and weighted average of 81.5%. Similarly, the statistical analysis conducted on geographies consisting of 61,774,977 people shows a mild negative correlation between the proportion of Aleuts and labor force participation rate among population between the ages 45 and 54 in the United States with a correlation coefficient (R) of -0.329 and weighted average of 81.0%, a difference of 0.67%.
In Labor Force | Age 45-54 Correlation Summary
| Measurement | Hawaiian | Aleut |
| Minimum | 47.8% | 12.5% |
| Maximum | 100.0% | 100.0% |
| Range | 52.2% | 87.5% |
| Mean | 81.0% | 78.8% |
| Median | 81.6% | 81.6% |
| Interquartile 25% (IQ1) | 79.1% | 70.3% |
| Interquartile 75% (IQ3) | 84.8% | 96.2% |
| Interquartile Range (IQR) | 5.8% | 25.9% |
| Standard Deviation (Sample) | 11.0% | 20.7% |
| Standard Deviation (Population) | 10.9% | 20.5% |
Similar Demographics by In Labor Force | Age 45-54
Demographics Similar to Hawaiians by In Labor Force | Age 45-54
In terms of in labor force | age 45-54, the demographic groups most similar to Hawaiians are Immigrants from Guyana (81.5%, a difference of 0.0%), Indonesian (81.5%, a difference of 0.010%), Spaniard (81.5%, a difference of 0.020%), Immigrants from West Indies (81.5%, a difference of 0.020%), and Guyanese (81.5%, a difference of 0.040%).
| Demographics | Rating | Rank | In Labor Force | Age 45-54 |
| Immigrants | Laos | 0.2 /100 | #254 | Tragic 81.6% |
| Scotch-Irish | 0.2 /100 | #255 | Tragic 81.6% |
| Barbadians | 0.1 /100 | #256 | Tragic 81.6% |
| Immigrants | Congo | 0.1 /100 | #257 | Tragic 81.6% |
| Immigrants | Fiji | 0.1 /100 | #258 | Tragic 81.5% |
| Guyanese | 0.1 /100 | #259 | Tragic 81.5% |
| Spaniards | 0.1 /100 | #260 | Tragic 81.5% |
| Hawaiians | 0.1 /100 | #261 | Tragic 81.5% |
| Immigrants | Guyana | 0.1 /100 | #262 | Tragic 81.5% |
| Indonesians | 0.1 /100 | #263 | Tragic 81.5% |
| Immigrants | West Indies | 0.1 /100 | #264 | Tragic 81.5% |
| Hondurans | 0.1 /100 | #265 | Tragic 81.4% |
| Immigrants | St. Vincent and the Grenadines | 0.1 /100 | #266 | Tragic 81.4% |
| West Indians | 0.1 /100 | #267 | Tragic 81.4% |
| Immigrants | Honduras | 0.0 /100 | #268 | Tragic 81.4% |
Demographics Similar to Aleuts by In Labor Force | Age 45-54
In terms of in labor force | age 45-54, the demographic groups most similar to Aleuts are Immigrants from Latin America (81.0%, a difference of 0.070%), Immigrants from Grenada (81.0%, a difference of 0.070%), French American Indian (80.8%, a difference of 0.17%), Immigrants from Micronesia (81.1%, a difference of 0.18%), and Immigrants from Guatemala (81.1%, a difference of 0.19%).
| Demographics | Rating | Rank | In Labor Force | Age 45-54 |
| Immigrants | Nonimmigrants | 0.0 /100 | #275 | Tragic 81.2% |
| U.S. Virgin Islanders | 0.0 /100 | #276 | Tragic 81.2% |
| Guatemalans | 0.0 /100 | #277 | Tragic 81.2% |
| Immigrants | Guatemala | 0.0 /100 | #278 | Tragic 81.1% |
| Immigrants | Micronesia | 0.0 /100 | #279 | Tragic 81.1% |
| Immigrants | Latin America | 0.0 /100 | #280 | Tragic 81.0% |
| Immigrants | Grenada | 0.0 /100 | #281 | Tragic 81.0% |
| Aleuts | 0.0 /100 | #282 | Tragic 81.0% |
| French American Indians | 0.0 /100 | #283 | Tragic 80.8% |
| Belizeans | 0.0 /100 | #284 | Tragic 80.8% |
| Delaware | 0.0 /100 | #285 | Tragic 80.8% |
| Immigrants | Dominica | 0.0 /100 | #286 | Tragic 80.8% |
| Vietnamese | 0.0 /100 | #287 | Tragic 80.8% |
| Cree | 0.0 /100 | #288 | Tragic 80.8% |
| Immigrants | Bangladesh | 0.0 /100 | #289 | Tragic 80.7% |