White/Caucasian vs Aleut In Labor Force | Age 45-54
COMPARE
White/Caucasian
Aleut
In Labor Force | Age 45-54
In Labor Force | Age 45-54 Comparison
Whites/Caucasians
Aleuts
81.9%
IN LABOR FORCE | AGE 45-54
0.7/ 100
METRIC RATING
242nd/ 347
METRIC RANK
81.0%
IN LABOR FORCE | AGE 45-54
0.0/ 100
METRIC RATING
282nd/ 347
METRIC RANK
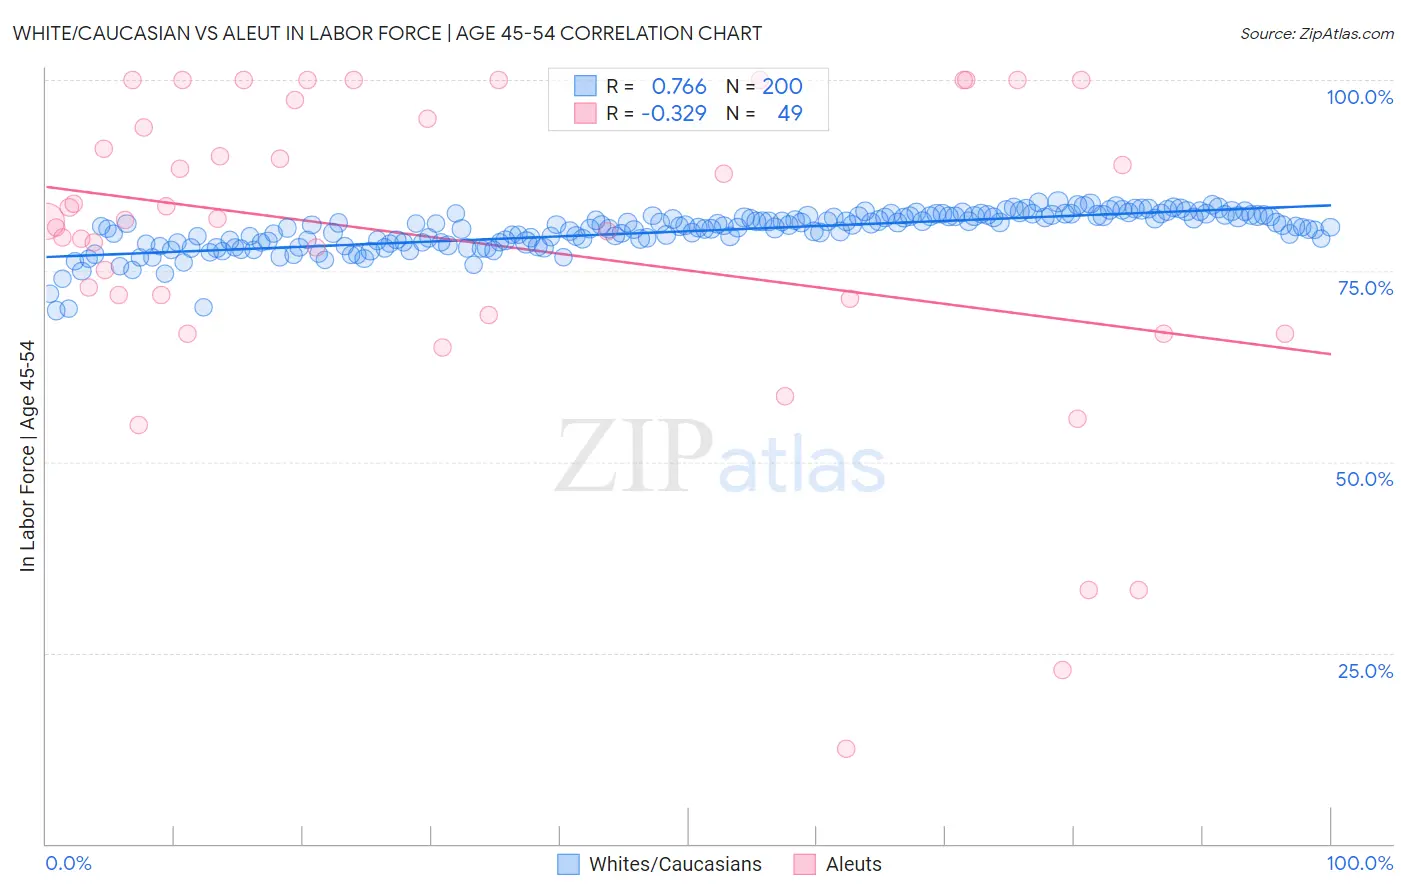
White/Caucasian vs Aleut In Labor Force | Age 45-54 Correlation Chart
The statistical analysis conducted on geographies consisting of 583,949,283 people shows a strong positive correlation between the proportion of Whites/Caucasians and labor force participation rate among population between the ages 45 and 54 in the United States with a correlation coefficient (R) of 0.766 and weighted average of 81.9%. Similarly, the statistical analysis conducted on geographies consisting of 61,774,977 people shows a mild negative correlation between the proportion of Aleuts and labor force participation rate among population between the ages 45 and 54 in the United States with a correlation coefficient (R) of -0.329 and weighted average of 81.0%, a difference of 1.1%.
In Labor Force | Age 45-54 Correlation Summary
| Measurement | White/Caucasian | Aleut |
| Minimum | 69.8% | 12.5% |
| Maximum | 84.0% | 100.0% |
| Range | 14.2% | 87.5% |
| Mean | 80.2% | 78.8% |
| Median | 80.8% | 81.6% |
| Interquartile 25% (IQ1) | 78.7% | 70.3% |
| Interquartile 75% (IQ3) | 82.2% | 96.2% |
| Interquartile Range (IQR) | 3.4% | 25.9% |
| Standard Deviation (Sample) | 2.6% | 20.7% |
| Standard Deviation (Population) | 2.6% | 20.5% |
Similar Demographics by In Labor Force | Age 45-54
Demographics Similar to Whites/Caucasians by In Labor Force | Age 45-54
In terms of in labor force | age 45-54, the demographic groups most similar to Whites/Caucasians are Samoan (81.8%, a difference of 0.010%), Immigrants from Cambodia (81.9%, a difference of 0.040%), Immigrants from Thailand (81.9%, a difference of 0.090%), Immigrants from El Salvador (81.9%, a difference of 0.090%), and Celtic (81.8%, a difference of 0.10%).
| Demographics | Rating | Rank | In Labor Force | Age 45-54 |
| Sub-Saharan Africans | 1.2 /100 | #235 | Tragic 82.0% |
| Basques | 1.2 /100 | #236 | Tragic 82.0% |
| Immigrants | Trinidad and Tobago | 1.2 /100 | #237 | Tragic 82.0% |
| Trinidadians and Tobagonians | 1.1 /100 | #238 | Tragic 81.9% |
| Immigrants | Thailand | 1.0 /100 | #239 | Tragic 81.9% |
| Immigrants | El Salvador | 1.0 /100 | #240 | Tragic 81.9% |
| Immigrants | Cambodia | 0.8 /100 | #241 | Tragic 81.9% |
| Whites/Caucasians | 0.7 /100 | #242 | Tragic 81.9% |
| Samoans | 0.6 /100 | #243 | Tragic 81.8% |
| Celtics | 0.4 /100 | #244 | Tragic 81.8% |
| Alaska Natives | 0.4 /100 | #245 | Tragic 81.8% |
| Alaskan Athabascans | 0.4 /100 | #246 | Tragic 81.8% |
| Central Americans | 0.4 /100 | #247 | Tragic 81.7% |
| Puget Sound Salish | 0.3 /100 | #248 | Tragic 81.7% |
| Hmong | 0.3 /100 | #249 | Tragic 81.7% |
Demographics Similar to Aleuts by In Labor Force | Age 45-54
In terms of in labor force | age 45-54, the demographic groups most similar to Aleuts are Immigrants from Latin America (81.0%, a difference of 0.070%), Immigrants from Grenada (81.0%, a difference of 0.070%), French American Indian (80.8%, a difference of 0.17%), Immigrants from Micronesia (81.1%, a difference of 0.18%), and Immigrants from Guatemala (81.1%, a difference of 0.19%).
| Demographics | Rating | Rank | In Labor Force | Age 45-54 |
| Immigrants | Nonimmigrants | 0.0 /100 | #275 | Tragic 81.2% |
| U.S. Virgin Islanders | 0.0 /100 | #276 | Tragic 81.2% |
| Guatemalans | 0.0 /100 | #277 | Tragic 81.2% |
| Immigrants | Guatemala | 0.0 /100 | #278 | Tragic 81.1% |
| Immigrants | Micronesia | 0.0 /100 | #279 | Tragic 81.1% |
| Immigrants | Latin America | 0.0 /100 | #280 | Tragic 81.0% |
| Immigrants | Grenada | 0.0 /100 | #281 | Tragic 81.0% |
| Aleuts | 0.0 /100 | #282 | Tragic 81.0% |
| French American Indians | 0.0 /100 | #283 | Tragic 80.8% |
| Belizeans | 0.0 /100 | #284 | Tragic 80.8% |
| Delaware | 0.0 /100 | #285 | Tragic 80.8% |
| Immigrants | Dominica | 0.0 /100 | #286 | Tragic 80.8% |
| Vietnamese | 0.0 /100 | #287 | Tragic 80.8% |
| Cree | 0.0 /100 | #288 | Tragic 80.8% |
| Immigrants | Bangladesh | 0.0 /100 | #289 | Tragic 80.7% |