Senegalese vs Aleut In Labor Force | Age 45-54
COMPARE
Senegalese
Aleut
In Labor Force | Age 45-54
In Labor Force | Age 45-54 Comparison
Senegalese
Aleuts
82.4%
IN LABOR FORCE | AGE 45-54
9.5/ 100
METRIC RATING
205th/ 347
METRIC RANK
81.0%
IN LABOR FORCE | AGE 45-54
0.0/ 100
METRIC RATING
282nd/ 347
METRIC RANK
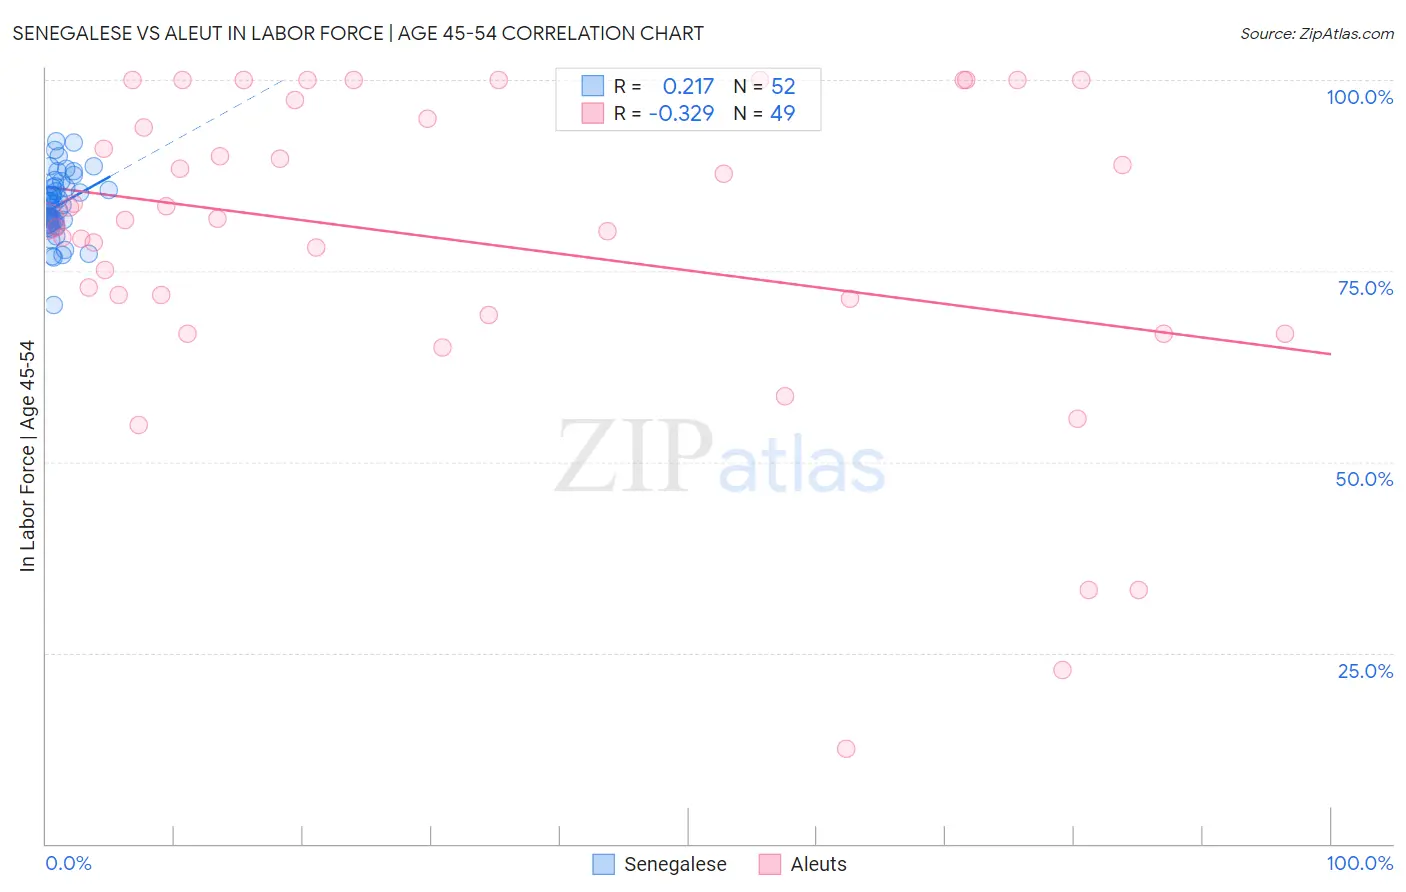
Senegalese vs Aleut In Labor Force | Age 45-54 Correlation Chart
The statistical analysis conducted on geographies consisting of 78,115,825 people shows a weak positive correlation between the proportion of Senegalese and labor force participation rate among population between the ages 45 and 54 in the United States with a correlation coefficient (R) of 0.217 and weighted average of 82.4%. Similarly, the statistical analysis conducted on geographies consisting of 61,774,977 people shows a mild negative correlation between the proportion of Aleuts and labor force participation rate among population between the ages 45 and 54 in the United States with a correlation coefficient (R) of -0.329 and weighted average of 81.0%, a difference of 1.7%.
In Labor Force | Age 45-54 Correlation Summary
| Measurement | Senegalese | Aleut |
| Minimum | 70.5% | 12.5% |
| Maximum | 92.0% | 100.0% |
| Range | 21.5% | 87.5% |
| Mean | 83.6% | 78.8% |
| Median | 83.7% | 81.6% |
| Interquartile 25% (IQ1) | 81.4% | 70.3% |
| Interquartile 75% (IQ3) | 86.0% | 96.2% |
| Interquartile Range (IQR) | 4.6% | 25.9% |
| Standard Deviation (Sample) | 4.2% | 20.7% |
| Standard Deviation (Population) | 4.1% | 20.5% |
Similar Demographics by In Labor Force | Age 45-54
Demographics Similar to Senegalese by In Labor Force | Age 45-54
In terms of in labor force | age 45-54, the demographic groups most similar to Senegalese are Welsh (82.3%, a difference of 0.010%), Immigrants from Western Europe (82.4%, a difference of 0.030%), Immigrants from Cabo Verde (82.3%, a difference of 0.030%), Native Hawaiian (82.3%, a difference of 0.030%), and Arab (82.4%, a difference of 0.050%).
| Demographics | Rating | Rank | In Labor Force | Age 45-54 |
| Immigrants | Denmark | 17.9 /100 | #198 | Poor 82.5% |
| Moroccans | 15.7 /100 | #199 | Poor 82.5% |
| French Canadians | 15.4 /100 | #200 | Poor 82.5% |
| Canadians | 15.1 /100 | #201 | Poor 82.4% |
| Immigrants | Western Asia | 14.9 /100 | #202 | Poor 82.4% |
| Arabs | 11.6 /100 | #203 | Poor 82.4% |
| Immigrants | Western Europe | 10.9 /100 | #204 | Poor 82.4% |
| Senegalese | 9.5 /100 | #205 | Tragic 82.4% |
| Welsh | 9.2 /100 | #206 | Tragic 82.3% |
| Immigrants | Cabo Verde | 8.6 /100 | #207 | Tragic 82.3% |
| Native Hawaiians | 8.5 /100 | #208 | Tragic 82.3% |
| Immigrants | Lebanon | 7.4 /100 | #209 | Tragic 82.3% |
| Immigrants | Bahamas | 7.1 /100 | #210 | Tragic 82.3% |
| Immigrants | Syria | 6.6 /100 | #211 | Tragic 82.3% |
| Ecuadorians | 6.3 /100 | #212 | Tragic 82.3% |
Demographics Similar to Aleuts by In Labor Force | Age 45-54
In terms of in labor force | age 45-54, the demographic groups most similar to Aleuts are Immigrants from Latin America (81.0%, a difference of 0.070%), Immigrants from Grenada (81.0%, a difference of 0.070%), French American Indian (80.8%, a difference of 0.17%), Immigrants from Micronesia (81.1%, a difference of 0.18%), and Immigrants from Guatemala (81.1%, a difference of 0.19%).
| Demographics | Rating | Rank | In Labor Force | Age 45-54 |
| Immigrants | Nonimmigrants | 0.0 /100 | #275 | Tragic 81.2% |
| U.S. Virgin Islanders | 0.0 /100 | #276 | Tragic 81.2% |
| Guatemalans | 0.0 /100 | #277 | Tragic 81.2% |
| Immigrants | Guatemala | 0.0 /100 | #278 | Tragic 81.1% |
| Immigrants | Micronesia | 0.0 /100 | #279 | Tragic 81.1% |
| Immigrants | Latin America | 0.0 /100 | #280 | Tragic 81.0% |
| Immigrants | Grenada | 0.0 /100 | #281 | Tragic 81.0% |
| Aleuts | 0.0 /100 | #282 | Tragic 81.0% |
| French American Indians | 0.0 /100 | #283 | Tragic 80.8% |
| Belizeans | 0.0 /100 | #284 | Tragic 80.8% |
| Delaware | 0.0 /100 | #285 | Tragic 80.8% |
| Immigrants | Dominica | 0.0 /100 | #286 | Tragic 80.8% |
| Vietnamese | 0.0 /100 | #287 | Tragic 80.8% |
| Cree | 0.0 /100 | #288 | Tragic 80.8% |
| Immigrants | Bangladesh | 0.0 /100 | #289 | Tragic 80.7% |