Cheyenne vs Immigrants from Ethiopia In Labor Force | Age 30-34
COMPARE
Cheyenne
Immigrants from Ethiopia
In Labor Force | Age 30-34
In Labor Force | Age 30-34 Comparison
Cheyenne
Immigrants from Ethiopia
81.1%
IN LABOR FORCE | AGE 30-34
0.0/ 100
METRIC RATING
324th/ 347
METRIC RANK
86.6%
IN LABOR FORCE | AGE 30-34
100.0/ 100
METRIC RATING
3rd/ 347
METRIC RANK
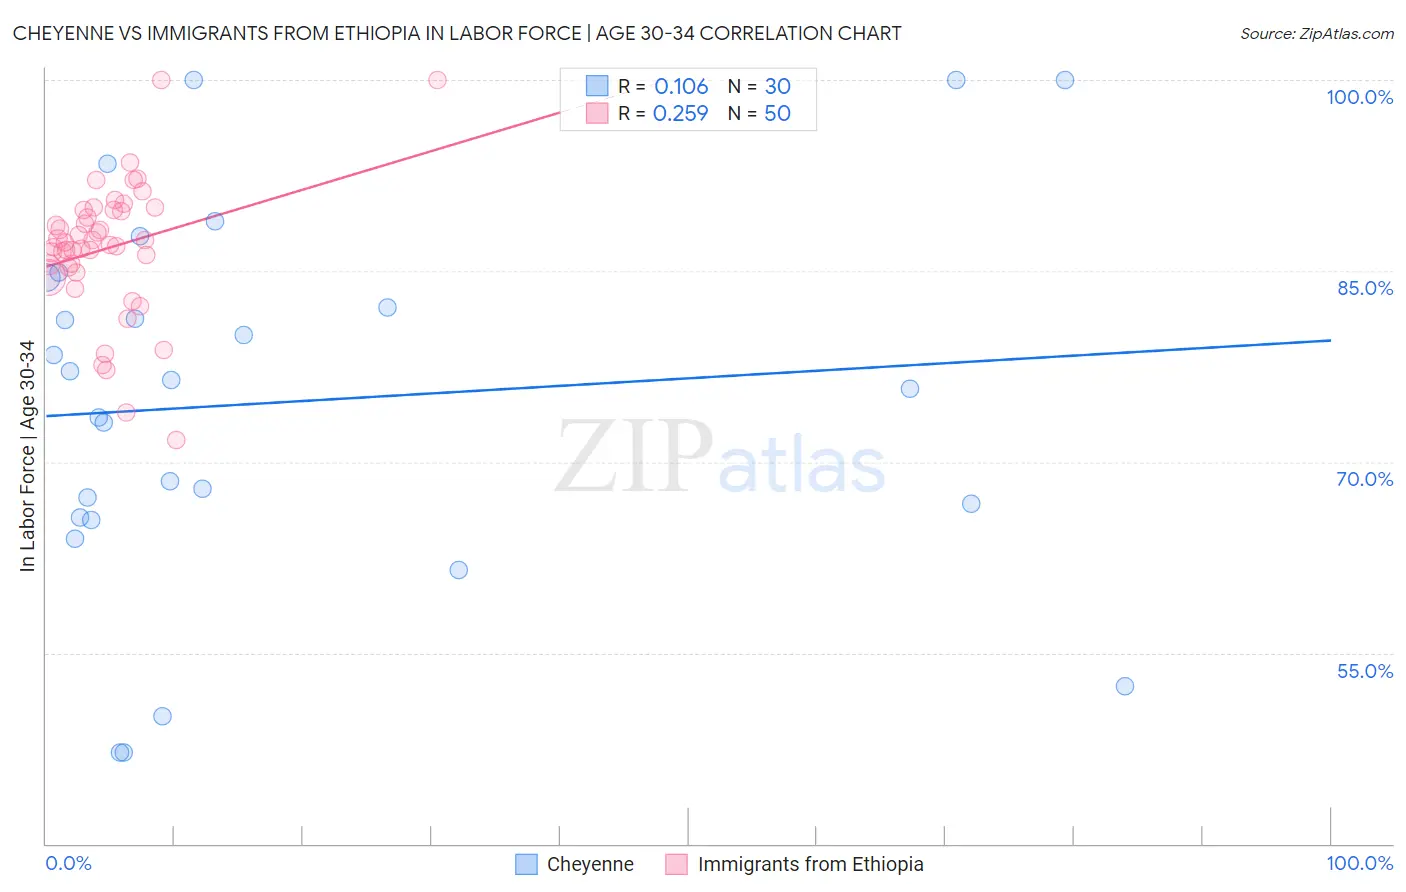
Cheyenne vs Immigrants from Ethiopia In Labor Force | Age 30-34 Correlation Chart
The statistical analysis conducted on geographies consisting of 80,694,830 people shows a poor positive correlation between the proportion of Cheyenne and labor force participation rate among population between the ages 30 and 34 in the United States with a correlation coefficient (R) of 0.106 and weighted average of 81.1%. Similarly, the statistical analysis conducted on geographies consisting of 211,483,251 people shows a weak positive correlation between the proportion of Immigrants from Ethiopia and labor force participation rate among population between the ages 30 and 34 in the United States with a correlation coefficient (R) of 0.259 and weighted average of 86.6%, a difference of 6.7%.
In Labor Force | Age 30-34 Correlation Summary
| Measurement | Cheyenne | Immigrants from Ethiopia |
| Minimum | 47.1% | 71.7% |
| Maximum | 100.0% | 100.0% |
| Range | 52.9% | 28.3% |
| Mean | 74.7% | 86.8% |
| Median | 76.0% | 87.1% |
| Interquartile 25% (IQ1) | 65.6% | 85.2% |
| Interquartile 75% (IQ3) | 84.5% | 89.8% |
| Interquartile Range (IQR) | 18.9% | 4.6% |
| Standard Deviation (Sample) | 14.8% | 5.3% |
| Standard Deviation (Population) | 14.5% | 5.3% |
Similar Demographics by In Labor Force | Age 30-34
Demographics Similar to Cheyenne by In Labor Force | Age 30-34
In terms of in labor force | age 30-34, the demographic groups most similar to Cheyenne are Paiute (81.2%, a difference of 0.030%), Puerto Rican (81.2%, a difference of 0.080%), Dutch West Indian (81.0%, a difference of 0.15%), Alaska Native (81.3%, a difference of 0.24%), and Yaqui (81.4%, a difference of 0.32%).
| Demographics | Rating | Rank | In Labor Force | Age 30-34 |
| Arapaho | 0.0 /100 | #317 | Tragic 81.5% |
| Choctaw | 0.0 /100 | #318 | Tragic 81.4% |
| Shoshone | 0.0 /100 | #319 | Tragic 81.4% |
| Yaqui | 0.0 /100 | #320 | Tragic 81.4% |
| Alaska Natives | 0.0 /100 | #321 | Tragic 81.3% |
| Puerto Ricans | 0.0 /100 | #322 | Tragic 81.2% |
| Paiute | 0.0 /100 | #323 | Tragic 81.2% |
| Cheyenne | 0.0 /100 | #324 | Tragic 81.1% |
| Dutch West Indians | 0.0 /100 | #325 | Tragic 81.0% |
| Seminole | 0.0 /100 | #326 | Tragic 80.8% |
| Colville | 0.0 /100 | #327 | Tragic 80.7% |
| Sioux | 0.0 /100 | #328 | Tragic 80.4% |
| Creek | 0.0 /100 | #329 | Tragic 80.4% |
| Pueblo | 0.0 /100 | #330 | Tragic 80.0% |
| Houma | 0.0 /100 | #331 | Tragic 79.9% |
Demographics Similar to Immigrants from Ethiopia by In Labor Force | Age 30-34
In terms of in labor force | age 30-34, the demographic groups most similar to Immigrants from Ethiopia are Ethiopian (86.6%, a difference of 0.010%), Luxembourger (86.6%, a difference of 0.080%), Liberian (86.4%, a difference of 0.19%), Immigrants from Ireland (86.3%, a difference of 0.34%), and Somali (86.2%, a difference of 0.37%).
| Demographics | Rating | Rank | In Labor Force | Age 30-34 |
| Luxembourgers | 100.0 /100 | #1 | Exceptional 86.6% |
| Ethiopians | 100.0 /100 | #2 | Exceptional 86.6% |
| Immigrants | Ethiopia | 100.0 /100 | #3 | Exceptional 86.6% |
| Liberians | 100.0 /100 | #4 | Exceptional 86.4% |
| Immigrants | Ireland | 100.0 /100 | #5 | Exceptional 86.3% |
| Somalis | 100.0 /100 | #6 | Exceptional 86.2% |
| Immigrants | Bolivia | 100.0 /100 | #7 | Exceptional 86.2% |
| Cambodians | 100.0 /100 | #8 | Exceptional 86.2% |
| Immigrants | Somalia | 100.0 /100 | #9 | Exceptional 86.2% |
| Immigrants | Serbia | 100.0 /100 | #10 | Exceptional 86.2% |
| Carpatho Rusyns | 100.0 /100 | #11 | Exceptional 86.2% |
| Bolivians | 100.0 /100 | #12 | Exceptional 86.1% |
| Immigrants | Croatia | 100.0 /100 | #13 | Exceptional 86.1% |
| Immigrants | Cabo Verde | 100.0 /100 | #14 | Exceptional 86.1% |
| Immigrants | Albania | 100.0 /100 | #15 | Exceptional 86.1% |