Carpatho Rusyn vs Immigrants from Ethiopia In Labor Force | Age 30-34
COMPARE
Carpatho Rusyn
Immigrants from Ethiopia
In Labor Force | Age 30-34
In Labor Force | Age 30-34 Comparison
Carpatho Rusyns
Immigrants from Ethiopia
86.2%
IN LABOR FORCE | AGE 30-34
100.0/ 100
METRIC RATING
11th/ 347
METRIC RANK
86.6%
IN LABOR FORCE | AGE 30-34
100.0/ 100
METRIC RATING
3rd/ 347
METRIC RANK
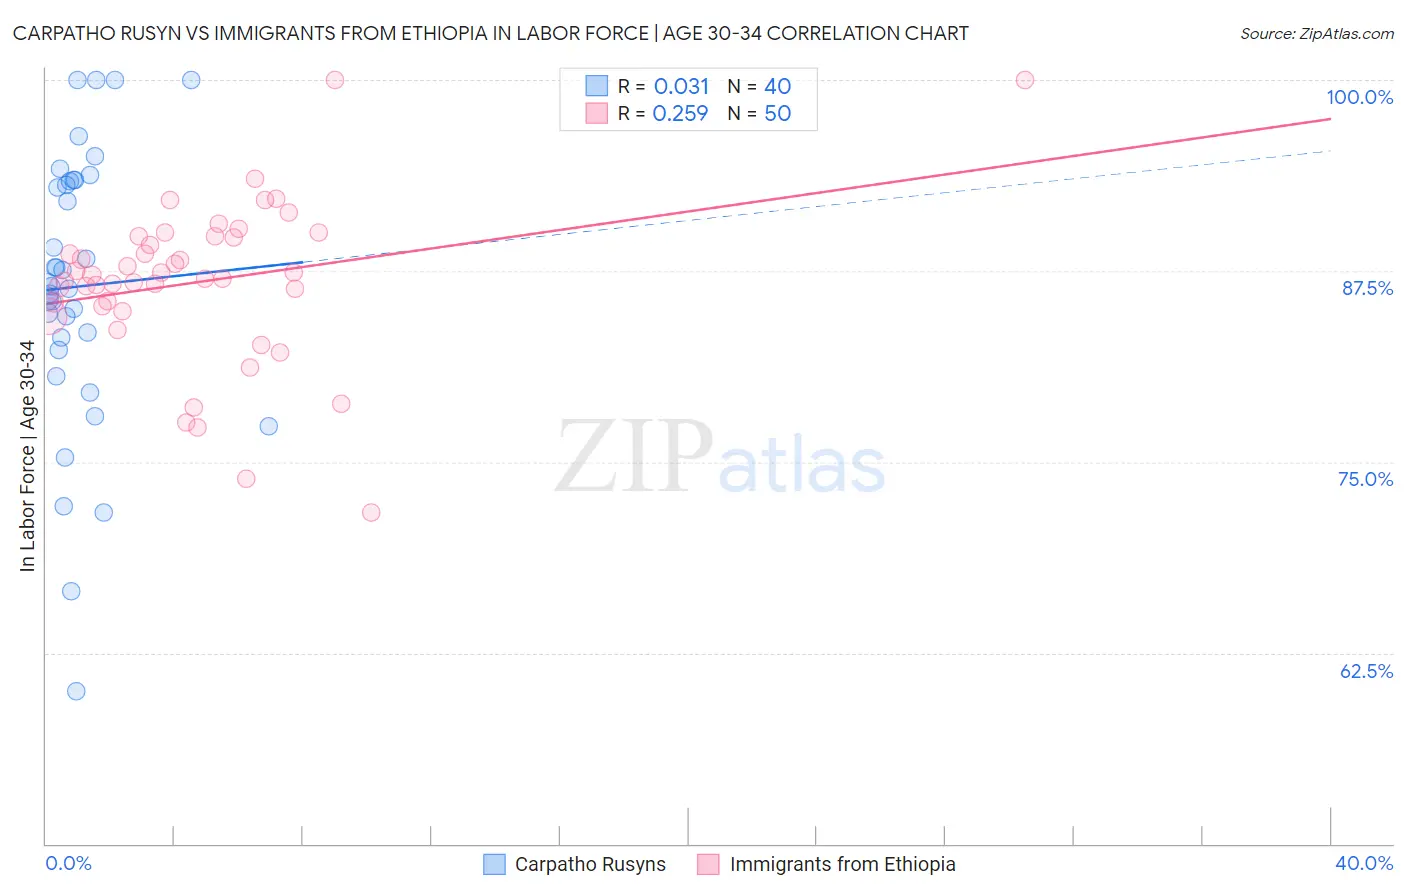
Carpatho Rusyn vs Immigrants from Ethiopia In Labor Force | Age 30-34 Correlation Chart
The statistical analysis conducted on geographies consisting of 58,871,401 people shows no correlation between the proportion of Carpatho Rusyns and labor force participation rate among population between the ages 30 and 34 in the United States with a correlation coefficient (R) of 0.031 and weighted average of 86.2%. Similarly, the statistical analysis conducted on geographies consisting of 211,483,251 people shows a weak positive correlation between the proportion of Immigrants from Ethiopia and labor force participation rate among population between the ages 30 and 34 in the United States with a correlation coefficient (R) of 0.259 and weighted average of 86.6%, a difference of 0.45%.
In Labor Force | Age 30-34 Correlation Summary
| Measurement | Carpatho Rusyn | Immigrants from Ethiopia |
| Minimum | 60.0% | 71.7% |
| Maximum | 100.0% | 100.0% |
| Range | 40.0% | 28.3% |
| Mean | 86.5% | 86.8% |
| Median | 86.6% | 87.1% |
| Interquartile 25% (IQ1) | 82.7% | 85.2% |
| Interquartile 75% (IQ3) | 93.4% | 89.8% |
| Interquartile Range (IQR) | 10.7% | 4.6% |
| Standard Deviation (Sample) | 9.1% | 5.3% |
| Standard Deviation (Population) | 9.0% | 5.3% |
Demographics Similar to Carpatho Rusyns and Immigrants from Ethiopia by In Labor Force | Age 30-34
In terms of in labor force | age 30-34, the demographic groups most similar to Carpatho Rusyns are Immigrants from Serbia (86.2%, a difference of 0.010%), Immigrants from Somalia (86.2%, a difference of 0.040%), Cambodian (86.2%, a difference of 0.060%), Immigrants from Bolivia (86.2%, a difference of 0.070%), and Somali (86.2%, a difference of 0.080%). Similarly, the demographic groups most similar to Immigrants from Ethiopia are Ethiopian (86.6%, a difference of 0.010%), Luxembourger (86.6%, a difference of 0.080%), Liberian (86.4%, a difference of 0.19%), Immigrants from Ireland (86.3%, a difference of 0.34%), and Somali (86.2%, a difference of 0.37%).
| Demographics | Rating | Rank | In Labor Force | Age 30-34 |
| Luxembourgers | 100.0 /100 | #1 | Exceptional 86.6% |
| Ethiopians | 100.0 /100 | #2 | Exceptional 86.6% |
| Immigrants | Ethiopia | 100.0 /100 | #3 | Exceptional 86.6% |
| Liberians | 100.0 /100 | #4 | Exceptional 86.4% |
| Immigrants | Ireland | 100.0 /100 | #5 | Exceptional 86.3% |
| Somalis | 100.0 /100 | #6 | Exceptional 86.2% |
| Immigrants | Bolivia | 100.0 /100 | #7 | Exceptional 86.2% |
| Cambodians | 100.0 /100 | #8 | Exceptional 86.2% |
| Immigrants | Somalia | 100.0 /100 | #9 | Exceptional 86.2% |
| Immigrants | Serbia | 100.0 /100 | #10 | Exceptional 86.2% |
| Carpatho Rusyns | 100.0 /100 | #11 | Exceptional 86.2% |
| Bolivians | 100.0 /100 | #12 | Exceptional 86.1% |
| Immigrants | Croatia | 100.0 /100 | #13 | Exceptional 86.1% |
| Immigrants | Cabo Verde | 100.0 /100 | #14 | Exceptional 86.1% |
| Immigrants | Albania | 100.0 /100 | #15 | Exceptional 86.1% |
| Latvians | 100.0 /100 | #16 | Exceptional 86.0% |
| Immigrants | Cameroon | 100.0 /100 | #17 | Exceptional 86.0% |
| Immigrants | Sierra Leone | 100.0 /100 | #18 | Exceptional 86.0% |
| Sierra Leoneans | 100.0 /100 | #19 | Exceptional 86.0% |
| Bulgarians | 100.0 /100 | #20 | Exceptional 86.0% |