Immigrants from Eastern Europe vs Immigrants from Ethiopia In Labor Force | Age 30-34

COMPARE

Immigrants from Eastern Europe
Race
Ancestry
AfghanAfricanAlaska NativeAlaskan AthabascanAlbanianAleutAlsatianAmericanApacheArabArapahoArgentineanArmenianAssyrian/Chaldean/SyriacAustralianAustrianBahamianBangladeshiBarbadianBasqueBelgianBelizeanBermudanBhutaneseBlackfeetBolivianBrazilianBritishBritish West IndianBulgarianBurmeseCajunCambodianCanadianCape VerdeanCarpatho RusynCelticCentral AmericanCentral American IndianCherokeeCheyenneChickasawChileanChineseChippewaChoctawColombianColvilleComancheCosta RicanCreeCreekCroatianCrowCubanCypriotCzechCzechoslovakianDanishDelawareDominicanDutchDutch West IndianEastern EuropeanEcuadorianEgyptianEnglishEstonianEthiopianEuropeanFijianFilipinoFinnishFrenchFrench American IndianFrench CanadianGermanGerman RussianGhanaianGreekGuamanian/ChamorroGuatemalanGuyaneseHaitianHmongHonduranHopiHoumaHungarianIcelanderIndian (Asian)IndonesianInupiatIranianIraqiIrishIroquoisIsraeliItalianJamaicanJapaneseJordanianKenyanKiowaKoreanLaotianLatvianLebaneseLiberianLithuanianLumbeeLuxembourgerMacedonianMalaysianMalteseMarshalleseMenomineeMexicanMexican American IndianMongolianMoroccanNative HawaiianNavajoNepaleseNew ZealanderNicaraguanNigerianNorthern EuropeanNorwegianOkinawanOsageOttawaPaiutePakistaniPalestinianPanamanianParaguayanPennsylvania GermanPeruvianPimaPolishPortuguesePotawatomiPuebloPuerto RicanPuget Sound SalishRomanianRussianSalvadoranSamoanScandinavianScotch-IrishScottishSeminoleSenegaleseSerbianShoshoneSierra LeoneanSiouxSlavicSlovakSloveneSomaliSouth AfricanSouth AmericanSouth American IndianSoviet UnionSpaniardSpanishSpanish AmericanSpanish American IndianSri LankanSubsaharan AfricanSudaneseSwedishSwissSyrianTaiwaneseThaiTlingit-HaidaTohono O'OdhamTonganTrinidadian and TobagonianTsimshianTurkishU.S. Virgin IslanderUgandanUkrainianUruguayanUteVenezuelanVietnameseWelshWest IndianYakamaYaquiYugoslavianYumanYup'ikZimbabwean
Immigration
NonimmigrantsImmigrantsAfghanistanAfricaAlbaniaArgentinaArmeniaAsiaAustraliaAustriaBahamasBangladeshBarbadosBelarusBelgiumBelizeBoliviaBosnia and HerzegovinaBrazilBulgariaBurma/MyanmarCabo VerdeCambodiaCameroonCanadaCaribbeanCentral AmericaChileChinaColombiaCongoCosta RicaCroatiaCubaCzechoslovakiaDenmarkDominicaDominican RepublicEastern AfricaEastern AsiaEastern EuropeEcuadorEgyptEl SalvadorEnglandEritreaEuropeFijiFranceGermanyGhanaGreeceGrenadaGuatemalaGuyanaHaitiHondurasHong KongHungaryIndiaIndonesiaIranIraqIrelandIsraelItalyJamaicaJapanJordanKazakhstanKenyaKoreaKuwaitLaosLatin AmericaLatviaLebanonLiberiaLithuaniaMalaysiaMexicoMicronesiaMiddle AfricaMoldovaMoroccoNepalNetherlandsNicaraguaNigeriaNorth AmericaNorth MacedoniaNorthern AfricaNorthern EuropeNorwayOceaniaPakistanPanamaPeruPhilippinesPolandPortugalRomaniaRussiaSaudi ArabiaScotlandSenegalSerbiaSierra LeoneSingaporeSomaliaSouth AfricaSouth AmericaSouth Central AsiaSouth Eastern AsiaSouthern EuropeSpainSri LankaSt. Vincent and the GrenadinesSudanSwedenSwitzerlandSyriaTaiwanThailandTrinidad and TobagoTurkeyUgandaUkraineUruguayUzbekistanVenezuelaVietnamWest IndiesWestern AfricaWestern AsiaWestern EuropeYemenZaireZimbabweAzores
Immigrants from Ethiopia
Race
Ancestry
AfghanAfricanAlaska NativeAlaskan AthabascanAlbanianAleutAlsatianAmericanApacheArabArapahoArgentineanArmenianAssyrian/Chaldean/SyriacAustralianAustrianBahamianBangladeshiBarbadianBasqueBelgianBelizeanBermudanBhutaneseBlackfeetBolivianBrazilianBritishBritish West IndianBulgarianBurmeseCajunCambodianCanadianCape VerdeanCarpatho RusynCelticCentral AmericanCentral American IndianCherokeeCheyenneChickasawChileanChineseChippewaChoctawColombianColvilleComancheCosta RicanCreeCreekCroatianCrowCubanCypriotCzechCzechoslovakianDanishDelawareDominicanDutchDutch West IndianEastern EuropeanEcuadorianEgyptianEnglishEstonianEthiopianEuropeanFijianFilipinoFinnishFrenchFrench American IndianFrench CanadianGermanGerman RussianGhanaianGreekGuamanian/ChamorroGuatemalanGuyaneseHaitianHmongHonduranHopiHoumaHungarianIcelanderIndian (Asian)IndonesianInupiatIranianIraqiIrishIroquoisIsraeliItalianJamaicanJapaneseJordanianKenyanKiowaKoreanLaotianLatvianLebaneseLiberianLithuanianLumbeeLuxembourgerMacedonianMalaysianMalteseMarshalleseMenomineeMexicanMexican American IndianMongolianMoroccanNative HawaiianNavajoNepaleseNew ZealanderNicaraguanNigerianNorthern EuropeanNorwegianOkinawanOsageOttawaPaiutePakistaniPalestinianPanamanianParaguayanPennsylvania GermanPeruvianPimaPolishPortuguesePotawatomiPuebloPuerto RicanPuget Sound SalishRomanianRussianSalvadoranSamoanScandinavianScotch-IrishScottishSeminoleSenegaleseSerbianShoshoneSierra LeoneanSiouxSlavicSlovakSloveneSomaliSouth AfricanSouth AmericanSouth American IndianSoviet UnionSpaniardSpanishSpanish AmericanSpanish American IndianSri LankanSubsaharan AfricanSudaneseSwedishSwissSyrianTaiwaneseThaiTlingit-HaidaTohono O'OdhamTonganTrinidadian and TobagonianTsimshianTurkishU.S. Virgin IslanderUgandanUkrainianUruguayanUteVenezuelanVietnameseWelshWest IndianYakamaYaquiYugoslavianYumanYup'ikZimbabwean
Immigration
NonimmigrantsImmigrantsAfghanistanAfricaAlbaniaArgentinaArmeniaAsiaAustraliaAustriaBahamasBangladeshBarbadosBelarusBelgiumBelizeBoliviaBosnia and HerzegovinaBrazilBulgariaBurma/MyanmarCabo VerdeCambodiaCameroonCanadaCaribbeanCentral AmericaChileChinaColombiaCongoCosta RicaCroatiaCubaCzechoslovakiaDenmarkDominicaDominican RepublicEastern AfricaEastern AsiaEcuadorEgyptEl SalvadorEnglandEritreaEthiopiaEuropeFijiFranceGermanyGhanaGreeceGrenadaGuatemalaGuyanaHaitiHondurasHong KongHungaryIndiaIndonesiaIranIraqIrelandIsraelItalyJamaicaJapanJordanKazakhstanKenyaKoreaKuwaitLaosLatin AmericaLatviaLebanonLiberiaLithuaniaMalaysiaMexicoMicronesiaMiddle AfricaMoldovaMoroccoNepalNetherlandsNicaraguaNigeriaNorth AmericaNorth MacedoniaNorthern AfricaNorthern EuropeNorwayOceaniaPakistanPanamaPeruPhilippinesPolandPortugalRomaniaRussiaSaudi ArabiaScotlandSenegalSerbiaSierra LeoneSingaporeSomaliaSouth AfricaSouth AmericaSouth Central AsiaSouth Eastern AsiaSouthern EuropeSpainSri LankaSt. Vincent and the GrenadinesSudanSwedenSwitzerlandSyriaTaiwanThailandTrinidad and TobagoTurkeyUgandaUkraineUruguayUzbekistanVenezuelaVietnamWest IndiesWestern AfricaWestern AsiaWestern EuropeYemenZaireZimbabweAzores
In Labor Force | Age 30-34
Income
Poverty
Unemployment
Labor Participation
Family Structure
Vehicle Availability
Education Level
Disability

In Labor Force | Age 30-34 Comparison

Immigrants from Eastern Europe

Immigrants from Ethiopia

Exceptional
Exceptional
85.4%
IN LABOR FORCE | AGE 30-34
99.3/ 100
METRIC RATING
68th/ 347
METRIC RANK
86.6%
IN LABOR FORCE | AGE 30-34
100.0/ 100
METRIC RATING
3rd/ 347
METRIC RANK

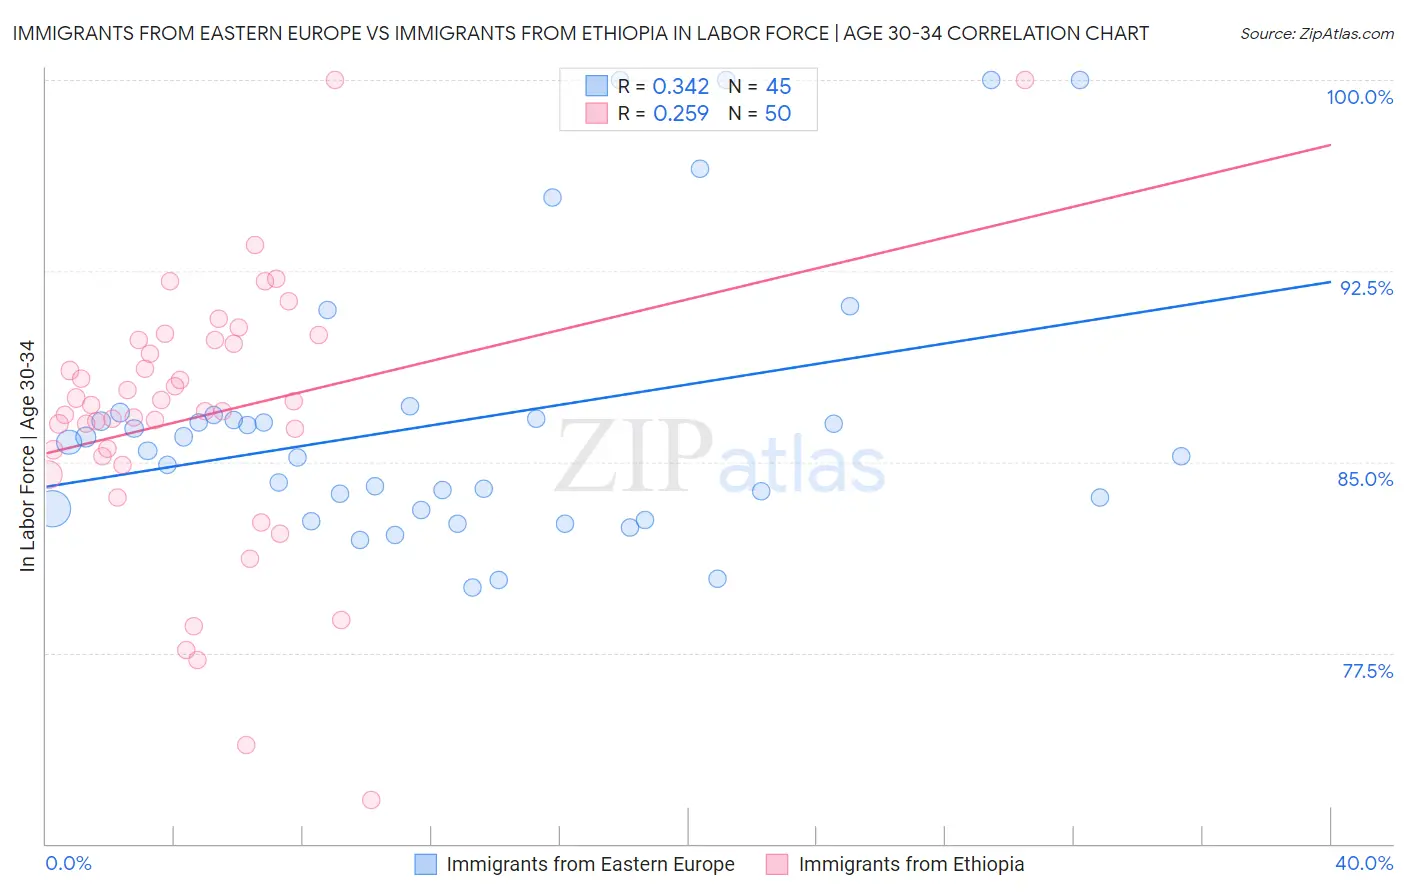
Immigrants from Eastern Europe vs Immigrants from Ethiopia In Labor Force | Age 30-34 Correlation Chart

The statistical analysis conducted on geographies consisting of 475,379,259 people shows a mild positive correlation between the proportion of Immigrants from Eastern Europe and labor force participation rate among population between the ages 30 and 34 in the United States with a correlation coefficient (R) of 0.342 and weighted average of 85.4%. Similarly, the statistical analysis conducted on geographies consisting of 211,483,251 people shows a weak positive correlation between the proportion of Immigrants from Ethiopia and labor force participation rate among population between the ages 30 and 34 in the United States with a correlation coefficient (R) of 0.259 and weighted average of 86.6%, a difference of 1.3%.
Immigrants from Eastern Europe vs Immigrants from Ethiopia In Labor Force | Age 30-34

In Labor Force | Age 30-34 Correlation Summary

MeasurementImmigrants from Eastern EuropeImmigrants from Ethiopia
Minimum80.0%71.7%
Maximum100.0%100.0%
Range20.0%28.3%
Mean86.6%86.8%
Median85.4%87.1%
Interquartile 25% (IQ1)83.1%85.2%
Interquartile 75% (IQ3)86.8%89.8%
Interquartile Range (IQR)3.6%4.6%
Standard Deviation (Sample)5.4%5.3%
Standard Deviation (Population)5.3%5.3%

Similar Demographics by In Labor Force | Age 30-34

Demographics Similar to Immigrants from Eastern Europe by In Labor Force | Age 30-34

In terms of in labor force | age 30-34, the demographic groups most similar to Immigrants from Eastern Europe are Ghanaian (85.4%, a difference of 0.010%), Kenyan (85.4%, a difference of 0.010%), Italian (85.4%, a difference of 0.020%), Senegalese (85.4%, a difference of 0.020%), and Macedonian (85.5%, a difference of 0.030%).
DemographicsRating | RankIn Labor Force | Age 30-34
Immigrants | Brazil
99.5
/100
|
#61
Exceptional
85.5%
Soviet Union
99.4
/100
|
#62
Exceptional
85.5%
Macedonians
99.4
/100
|
#63
Exceptional
85.5%
Italians
99.4
/100
|
#64
Exceptional
85.4%
Senegalese
99.4
/100
|
#65
Exceptional
85.4%
Ghanaians
99.4
/100
|
#66
Exceptional
85.4%
Kenyans
99.3
/100
|
#67
Exceptional
85.4%
Immigrants | Eastern Europe
99.3
/100
|
#68
Exceptional
85.4%
Immigrants | Iran
99.2
/100
|
#69
Exceptional
85.4%
Brazilians
99.1
/100
|
#70
Exceptional
85.4%
Immigrants | Japan
99.1
/100
|
#71
Exceptional
85.4%
Immigrants | China
99.0
/100
|
#72
Exceptional
85.4%
Indians (Asian)
99.0
/100
|
#73
Exceptional
85.4%
Maltese
99.0
/100
|
#74
Exceptional
85.4%
Immigrants | Czechoslovakia
99.0
/100
|
#75
Exceptional
85.4%

Demographics Similar to Immigrants from Ethiopia by In Labor Force | Age 30-34

In terms of in labor force | age 30-34, the demographic groups most similar to Immigrants from Ethiopia are Ethiopian (86.6%, a difference of 0.010%), Luxembourger (86.6%, a difference of 0.080%), Liberian (86.4%, a difference of 0.19%), Immigrants from Ireland (86.3%, a difference of 0.34%), and Somali (86.2%, a difference of 0.37%).
DemographicsRating | RankIn Labor Force | Age 30-34
Luxembourgers
100.0
/100
|
#1
Exceptional
86.6%
Ethiopians
100.0
/100
|
#2
Exceptional
86.6%
Immigrants | Ethiopia
100.0
/100
|
#3
Exceptional
86.6%
Liberians
100.0
/100
|
#4
Exceptional
86.4%
Immigrants | Ireland
100.0
/100
|
#5
Exceptional
86.3%
Somalis
100.0
/100
|
#6
Exceptional
86.2%
Immigrants | Bolivia
100.0
/100
|
#7
Exceptional
86.2%
Cambodians
100.0
/100
|
#8
Exceptional
86.2%
Immigrants | Somalia
100.0
/100
|
#9
Exceptional
86.2%
Immigrants | Serbia
100.0
/100
|
#10
Exceptional
86.2%
Carpatho Rusyns
100.0
/100
|
#11
Exceptional
86.2%
Bolivians
100.0
/100
|
#12
Exceptional
86.1%
Immigrants | Croatia
100.0
/100
|
#13
Exceptional
86.1%
Immigrants | Cabo Verde
100.0
/100
|
#14
Exceptional
86.1%
Immigrants | Albania
100.0
/100
|
#15
Exceptional
86.1%