Central American vs German Russian In Labor Force | Age > 16
COMPARE
Central American
German Russian
In Labor Force | Age > 16
In Labor Force | Age > 16 Comparison
Central Americans
German Russians
66.1%
IN LABOR FORCE | AGE > 16
99.4/ 100
METRIC RATING
84th/ 347
METRIC RANK
66.1%
IN LABOR FORCE | AGE > 16
99.4/ 100
METRIC RATING
82nd/ 347
METRIC RANK
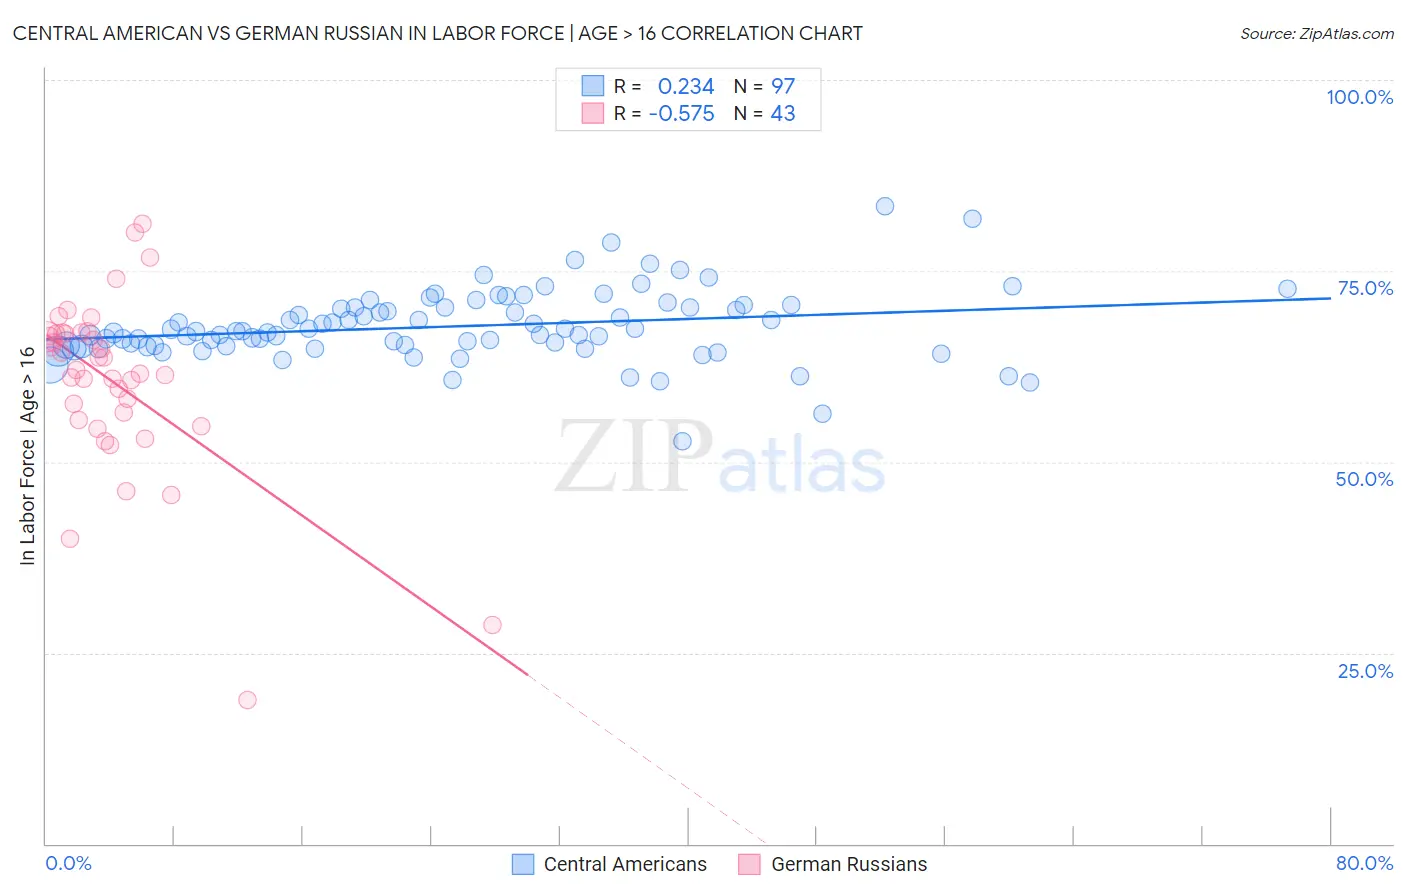
Central American vs German Russian In Labor Force | Age > 16 Correlation Chart
The statistical analysis conducted on geographies consisting of 504,613,567 people shows a weak positive correlation between the proportion of Central Americans and labor force participation rate among population ages 16 and over in the United States with a correlation coefficient (R) of 0.234 and weighted average of 66.1%. Similarly, the statistical analysis conducted on geographies consisting of 96,458,979 people shows a substantial negative correlation between the proportion of German Russians and labor force participation rate among population ages 16 and over in the United States with a correlation coefficient (R) of -0.575 and weighted average of 66.1%, a difference of 0.010%.
In Labor Force | Age > 16 Correlation Summary
| Measurement | Central American | German Russian |
| Minimum | 52.7% | 18.8% |
| Maximum | 83.5% | 81.2% |
| Range | 30.8% | 62.4% |
| Mean | 67.7% | 60.5% |
| Median | 67.0% | 62.0% |
| Interquartile 25% (IQ1) | 65.2% | 55.5% |
| Interquartile 75% (IQ3) | 70.3% | 66.8% |
| Interquartile Range (IQR) | 5.1% | 11.4% |
| Standard Deviation (Sample) | 4.7% | 11.8% |
| Standard Deviation (Population) | 4.6% | 11.6% |
Demographics Similar to Central Americans and German Russians by In Labor Force | Age > 16
In terms of in labor force | age > 16, the demographic groups most similar to Central Americans are Immigrants from Jordan (66.1%, a difference of 0.0%), Moroccan (66.1%, a difference of 0.020%), Mongolian (66.1%, a difference of 0.020%), South American (66.0%, a difference of 0.030%), and South American Indian (66.0%, a difference of 0.040%). Similarly, the demographic groups most similar to German Russians are Immigrants from Jordan (66.1%, a difference of 0.0%), Moroccan (66.1%, a difference of 0.010%), Mongolian (66.1%, a difference of 0.020%), South American (66.0%, a difference of 0.040%), and South American Indian (66.0%, a difference of 0.040%).
| Demographics | Rating | Rank | In Labor Force | Age > 16 |
| Immigrants | Vietnam | 99.7 /100 | #73 | Exceptional 66.2% |
| Immigrants | Korea | 99.7 /100 | #74 | Exceptional 66.2% |
| Immigrants | Singapore | 99.7 /100 | #75 | Exceptional 66.2% |
| Immigrants | Malaysia | 99.6 /100 | #76 | Exceptional 66.1% |
| Immigrants | Moldova | 99.6 /100 | #77 | Exceptional 66.1% |
| Immigrants | Asia | 99.6 /100 | #78 | Exceptional 66.1% |
| Turks | 99.6 /100 | #79 | Exceptional 66.1% |
| Malaysians | 99.6 /100 | #80 | Exceptional 66.1% |
| Moroccans | 99.5 /100 | #81 | Exceptional 66.1% |
| German Russians | 99.4 /100 | #82 | Exceptional 66.1% |
| Immigrants | Jordan | 99.4 /100 | #83 | Exceptional 66.1% |
| Central Americans | 99.4 /100 | #84 | Exceptional 66.1% |
| Mongolians | 99.4 /100 | #85 | Exceptional 66.1% |
| South Americans | 99.4 /100 | #86 | Exceptional 66.0% |
| South American Indians | 99.4 /100 | #87 | Exceptional 66.0% |
| Bermudans | 99.3 /100 | #88 | Exceptional 66.0% |
| Immigrants | Laos | 99.2 /100 | #89 | Exceptional 66.0% |
| Chileans | 99.2 /100 | #90 | Exceptional 66.0% |
| Iranians | 99.2 /100 | #91 | Exceptional 66.0% |
| Aleuts | 99.1 /100 | #92 | Exceptional 66.0% |
| Immigrants | South America | 99.1 /100 | #93 | Exceptional 66.0% |