Celtic vs Belgian In Labor Force | Age 20-64
COMPARE
Celtic
Belgian
In Labor Force | Age 20-64
In Labor Force | Age 20-64 Comparison
Celtics
Belgians
78.7%
IN LABOR FORCE | AGE 20-64
0.5/ 100
METRIC RATING
256th/ 347
METRIC RANK
79.9%
IN LABOR FORCE | AGE 20-64
87.4/ 100
METRIC RATING
134th/ 347
METRIC RANK
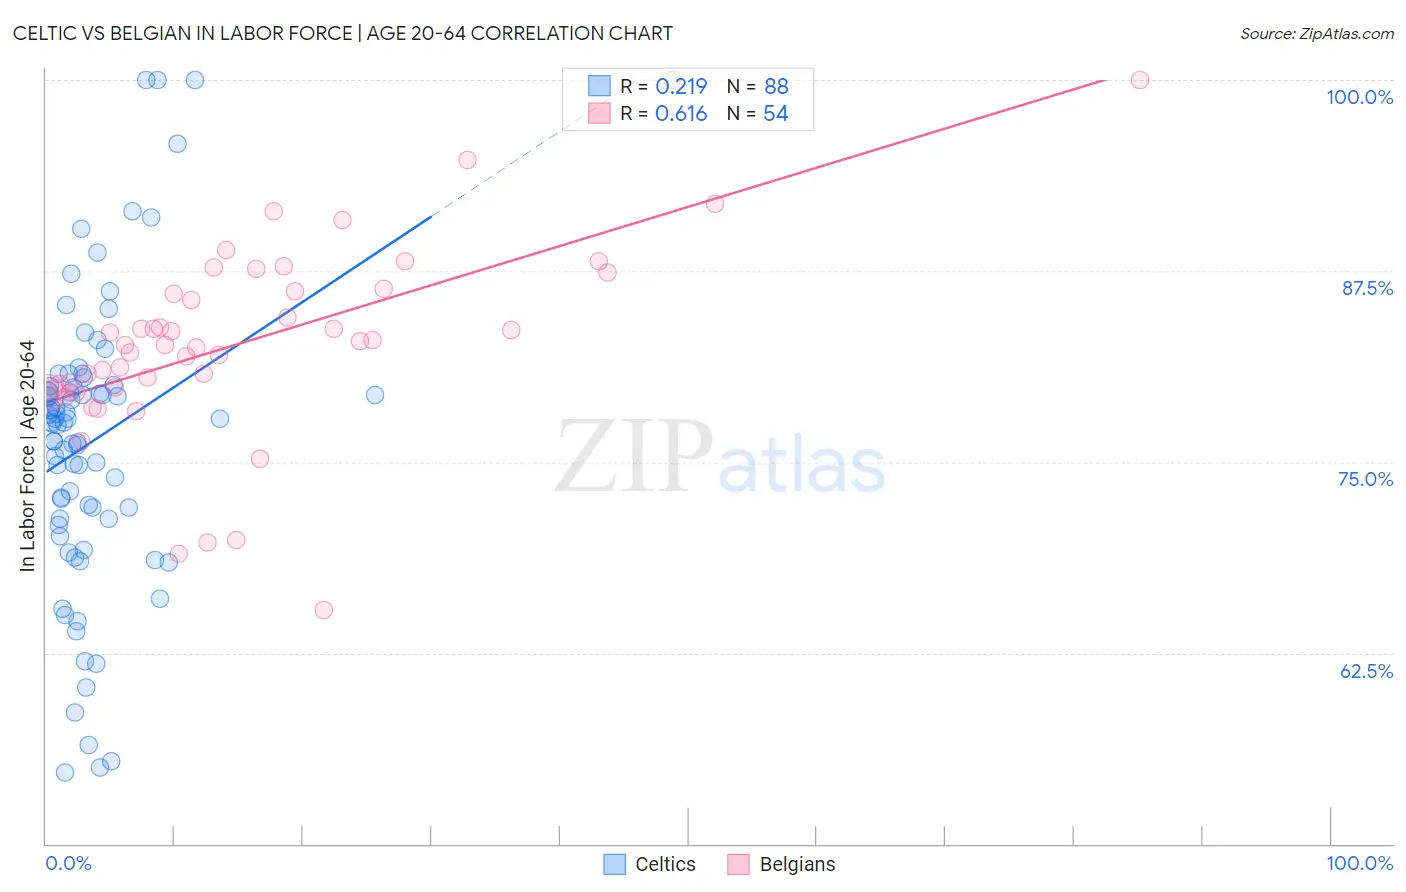
Celtic vs Belgian In Labor Force | Age 20-64 Correlation Chart
The statistical analysis conducted on geographies consisting of 168,869,465 people shows a weak positive correlation between the proportion of Celtics and labor force participation rate among population between the ages 20 and 64 in the United States with a correlation coefficient (R) of 0.219 and weighted average of 78.7%. Similarly, the statistical analysis conducted on geographies consisting of 356,033,088 people shows a significant positive correlation between the proportion of Belgians and labor force participation rate among population between the ages 20 and 64 in the United States with a correlation coefficient (R) of 0.616 and weighted average of 79.9%, a difference of 1.5%.
In Labor Force | Age 20-64 Correlation Summary
| Measurement | Celtic | Belgian |
| Minimum | 54.7% | 65.3% |
| Maximum | 100.0% | 100.0% |
| Range | 45.3% | 34.7% |
| Mean | 76.2% | 83.0% |
| Median | 77.6% | 82.8% |
| Interquartile 25% (IQ1) | 71.3% | 79.9% |
| Interquartile 75% (IQ3) | 79.9% | 86.3% |
| Interquartile Range (IQR) | 8.6% | 6.4% |
| Standard Deviation (Sample) | 9.3% | 6.5% |
| Standard Deviation (Population) | 9.3% | 6.5% |
Similar Demographics by In Labor Force | Age 20-64
Demographics Similar to Celtics by In Labor Force | Age 20-64
In terms of in labor force | age 20-64, the demographic groups most similar to Celtics are Hawaiian (78.7%, a difference of 0.0%), Basque (78.7%, a difference of 0.020%), Immigrants from Lebanon (78.7%, a difference of 0.020%), Guatemalan (78.7%, a difference of 0.020%), and Immigrants from Guatemala (78.7%, a difference of 0.020%).
| Demographics | Rating | Rank | In Labor Force | Age 20-64 |
| English | 0.9 /100 | #249 | Tragic 78.8% |
| Hondurans | 0.8 /100 | #250 | Tragic 78.8% |
| Barbadians | 0.7 /100 | #251 | Tragic 78.8% |
| Immigrants | Honduras | 0.6 /100 | #252 | Tragic 78.7% |
| Basques | 0.5 /100 | #253 | Tragic 78.7% |
| Immigrants | Lebanon | 0.5 /100 | #254 | Tragic 78.7% |
| Hawaiians | 0.5 /100 | #255 | Tragic 78.7% |
| Celtics | 0.5 /100 | #256 | Tragic 78.7% |
| Guatemalans | 0.4 /100 | #257 | Tragic 78.7% |
| Immigrants | Guatemala | 0.4 /100 | #258 | Tragic 78.7% |
| Tsimshian | 0.4 /100 | #259 | Tragic 78.7% |
| Immigrants | Fiji | 0.3 /100 | #260 | Tragic 78.6% |
| Whites/Caucasians | 0.2 /100 | #261 | Tragic 78.5% |
| Fijians | 0.1 /100 | #262 | Tragic 78.4% |
| Pennsylvania Germans | 0.1 /100 | #263 | Tragic 78.4% |
Demographics Similar to Belgians by In Labor Force | Age 20-64
In terms of in labor force | age 20-64, the demographic groups most similar to Belgians are Indian (Asian) (79.9%, a difference of 0.0%), South American Indian (79.9%, a difference of 0.0%), Ukrainian (79.9%, a difference of 0.010%), Immigrants from Singapore (79.9%, a difference of 0.010%), and Immigrants from Zaire (79.9%, a difference of 0.020%).
| Demographics | Rating | Rank | In Labor Force | Age 20-64 |
| Immigrants | Czechoslovakia | 89.7 /100 | #127 | Excellent 79.9% |
| Immigrants | Eastern Asia | 89.4 /100 | #128 | Excellent 79.9% |
| Italians | 88.9 /100 | #129 | Excellent 79.9% |
| Immigrants | Zaire | 88.6 /100 | #130 | Excellent 79.9% |
| Immigrants | Iran | 88.3 /100 | #131 | Excellent 79.9% |
| Indians (Asian) | 87.7 /100 | #132 | Excellent 79.9% |
| South American Indians | 87.6 /100 | #133 | Excellent 79.9% |
| Belgians | 87.4 /100 | #134 | Excellent 79.9% |
| Ukrainians | 86.8 /100 | #135 | Excellent 79.9% |
| Immigrants | Singapore | 86.7 /100 | #136 | Excellent 79.9% |
| Immigrants | Ukraine | 86.5 /100 | #137 | Excellent 79.9% |
| Immigrants | Nigeria | 86.4 /100 | #138 | Excellent 79.9% |
| Immigrants | Spain | 83.9 /100 | #139 | Excellent 79.8% |
| Immigrants | South Eastern Asia | 80.4 /100 | #140 | Excellent 79.8% |
| Immigrants | Israel | 80.0 /100 | #141 | Good 79.8% |