Carpatho Rusyn vs Immigrants from Portugal In Labor Force | Age 20-64
COMPARE
Carpatho Rusyn
Immigrants from Portugal
In Labor Force | Age 20-64
In Labor Force | Age 20-64 Comparison
Carpatho Rusyns
Immigrants from Portugal
80.3%
IN LABOR FORCE | AGE 20-64
98.8/ 100
METRIC RATING
62nd/ 347
METRIC RANK
79.3%
IN LABOR FORCE | AGE 20-64
12.8/ 100
METRIC RATING
213th/ 347
METRIC RANK
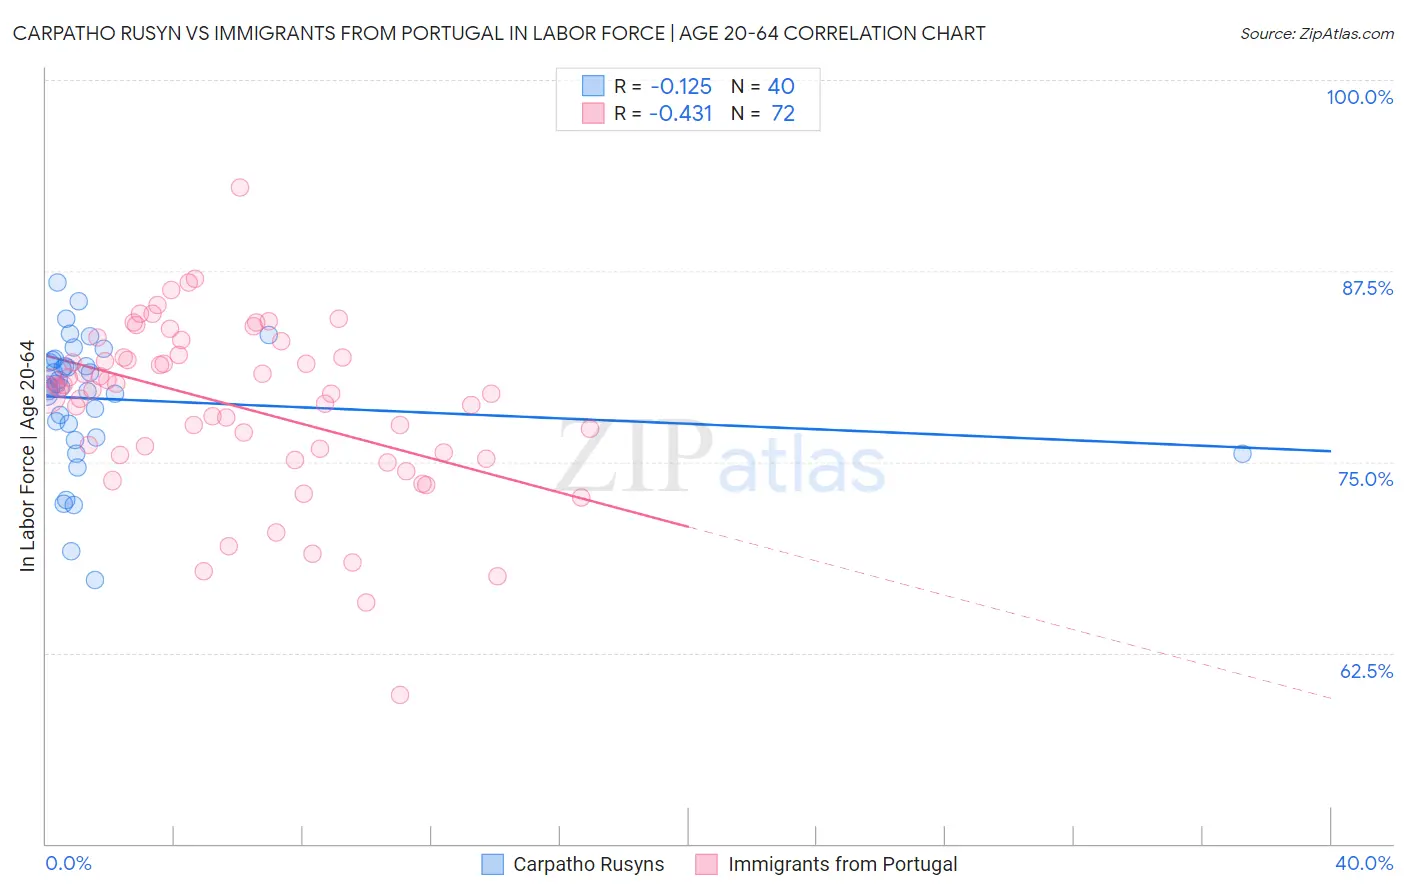
Carpatho Rusyn vs Immigrants from Portugal In Labor Force | Age 20-64 Correlation Chart
The statistical analysis conducted on geographies consisting of 58,872,065 people shows a poor negative correlation between the proportion of Carpatho Rusyns and labor force participation rate among population between the ages 20 and 64 in the United States with a correlation coefficient (R) of -0.125 and weighted average of 80.3%. Similarly, the statistical analysis conducted on geographies consisting of 174,779,205 people shows a moderate negative correlation between the proportion of Immigrants from Portugal and labor force participation rate among population between the ages 20 and 64 in the United States with a correlation coefficient (R) of -0.431 and weighted average of 79.3%, a difference of 1.3%.
In Labor Force | Age 20-64 Correlation Summary
| Measurement | Carpatho Rusyn | Immigrants from Portugal |
| Minimum | 67.3% | 59.7% |
| Maximum | 86.8% | 93.0% |
| Range | 19.5% | 33.3% |
| Mean | 79.1% | 78.7% |
| Median | 80.0% | 79.7% |
| Interquartile 25% (IQ1) | 77.0% | 75.5% |
| Interquartile 75% (IQ3) | 81.6% | 82.0% |
| Interquartile Range (IQR) | 4.5% | 6.4% |
| Standard Deviation (Sample) | 4.2% | 5.6% |
| Standard Deviation (Population) | 4.2% | 5.6% |
Similar Demographics by In Labor Force | Age 20-64
Demographics Similar to Carpatho Rusyns by In Labor Force | Age 20-64
In terms of in labor force | age 20-64, the demographic groups most similar to Carpatho Rusyns are Tongan (80.3%, a difference of 0.0%), Burmese (80.3%, a difference of 0.0%), Serbian (80.3%, a difference of 0.010%), Swedish (80.3%, a difference of 0.010%), and Immigrants from Korea (80.3%, a difference of 0.010%).
| Demographics | Rating | Rank | In Labor Force | Age 20-64 |
| Immigrants | Cabo Verde | 99.0 /100 | #55 | Exceptional 80.3% |
| Immigrants | Northern Africa | 99.0 /100 | #56 | Exceptional 80.3% |
| Afghans | 98.9 /100 | #57 | Exceptional 80.3% |
| Serbians | 98.9 /100 | #58 | Exceptional 80.3% |
| Swedes | 98.9 /100 | #59 | Exceptional 80.3% |
| Tongans | 98.8 /100 | #60 | Exceptional 80.3% |
| Burmese | 98.8 /100 | #61 | Exceptional 80.3% |
| Carpatho Rusyns | 98.8 /100 | #62 | Exceptional 80.3% |
| Immigrants | Korea | 98.8 /100 | #63 | Exceptional 80.3% |
| Immigrants | Albania | 98.7 /100 | #64 | Exceptional 80.3% |
| Lithuanians | 98.7 /100 | #65 | Exceptional 80.2% |
| Macedonians | 98.7 /100 | #66 | Exceptional 80.2% |
| Taiwanese | 98.6 /100 | #67 | Exceptional 80.2% |
| Bhutanese | 98.6 /100 | #68 | Exceptional 80.2% |
| Albanians | 98.6 /100 | #69 | Exceptional 80.2% |
Demographics Similar to Immigrants from Portugal by In Labor Force | Age 20-64
In terms of in labor force | age 20-64, the demographic groups most similar to Immigrants from Portugal are Irish (79.3%, a difference of 0.010%), Immigrants from Armenia (79.2%, a difference of 0.010%), Immigrants from Norway (79.2%, a difference of 0.020%), Arab (79.2%, a difference of 0.030%), and Immigrants from Western Asia (79.2%, a difference of 0.030%).
| Demographics | Rating | Rank | In Labor Force | Age 20-64 |
| Immigrants | Ecuador | 16.9 /100 | #206 | Poor 79.3% |
| Sub-Saharan Africans | 16.5 /100 | #207 | Poor 79.3% |
| British | 16.5 /100 | #208 | Poor 79.3% |
| Bangladeshis | 16.4 /100 | #209 | Poor 79.3% |
| Haitians | 16.1 /100 | #210 | Poor 79.3% |
| Europeans | 15.3 /100 | #211 | Poor 79.3% |
| Irish | 13.2 /100 | #212 | Poor 79.3% |
| Immigrants | Portugal | 12.8 /100 | #213 | Poor 79.3% |
| Immigrants | Armenia | 12.2 /100 | #214 | Poor 79.2% |
| Immigrants | Norway | 12.0 /100 | #215 | Poor 79.2% |
| Arabs | 11.4 /100 | #216 | Poor 79.2% |
| Immigrants | Western Asia | 11.0 /100 | #217 | Poor 79.2% |
| Immigrants | England | 9.3 /100 | #218 | Tragic 79.2% |
| French Canadians | 8.4 /100 | #219 | Tragic 79.2% |
| Immigrants | Immigrants | 7.7 /100 | #220 | Tragic 79.2% |