Carpatho Rusyn vs Immigrants from Ethiopia Receiving Food Stamps
COMPARE
Carpatho Rusyn
Immigrants from Ethiopia
Receiving Food Stamps
Receiving Food Stamps Comparison
Carpatho Rusyns
Immigrants from Ethiopia
10.4%
RECEIVING FOOD STAMPS
96.2/ 100
METRIC RATING
108th/ 347
METRIC RANK
10.7%
RECEIVING FOOD STAMPS
92.6/ 100
METRIC RATING
127th/ 347
METRIC RANK
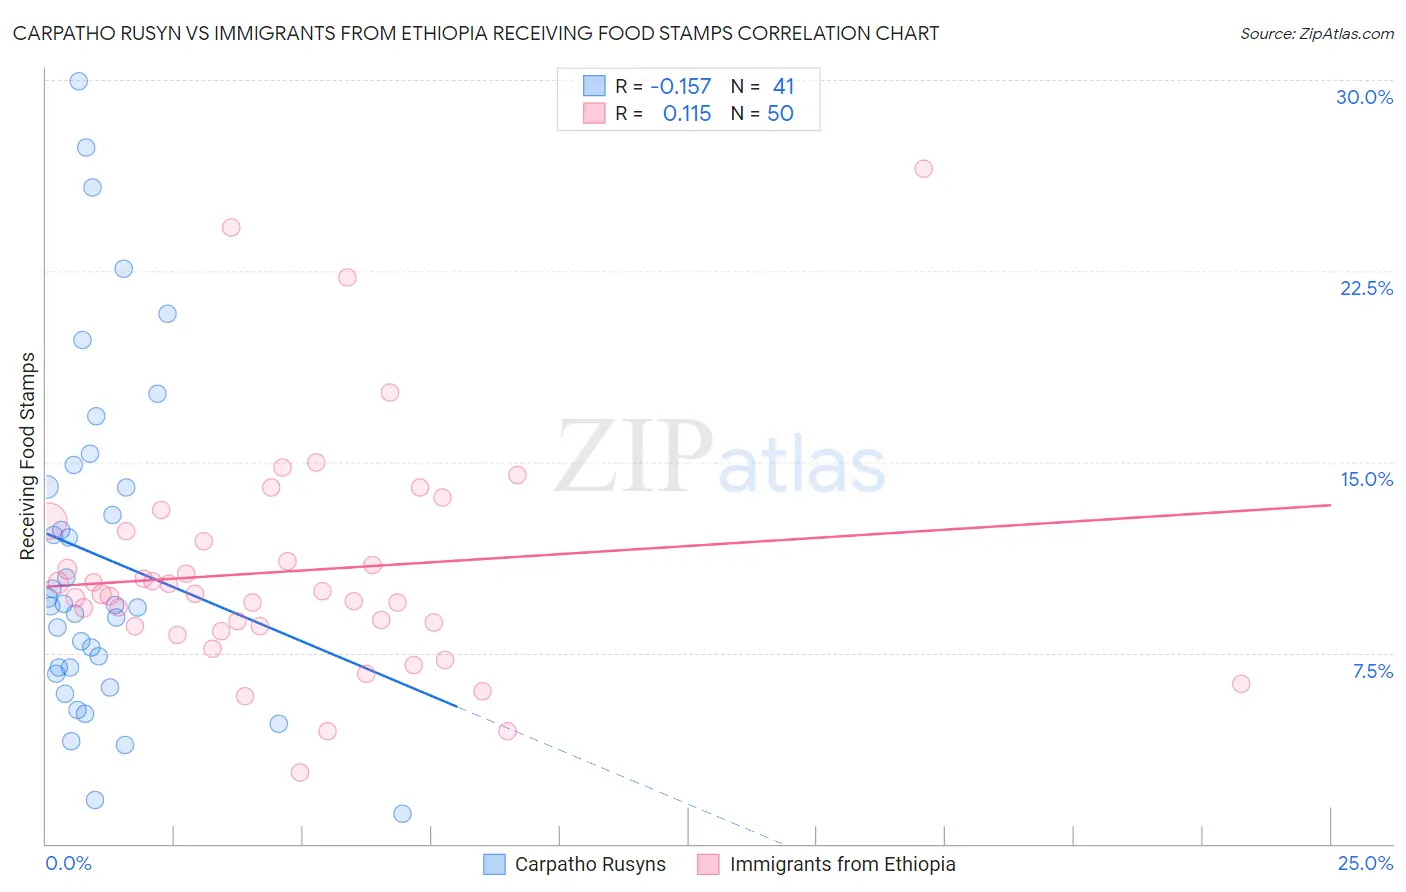
Carpatho Rusyn vs Immigrants from Ethiopia Receiving Food Stamps Correlation Chart
The statistical analysis conducted on geographies consisting of 58,758,722 people shows a poor negative correlation between the proportion of Carpatho Rusyns and percentage of population receiving government assistance and/or food stamps in the United States with a correlation coefficient (R) of -0.157 and weighted average of 10.4%. Similarly, the statistical analysis conducted on geographies consisting of 211,250,124 people shows a poor positive correlation between the proportion of Immigrants from Ethiopia and percentage of population receiving government assistance and/or food stamps in the United States with a correlation coefficient (R) of 0.115 and weighted average of 10.7%, a difference of 2.9%.
Receiving Food Stamps Correlation Summary
| Measurement | Carpatho Rusyn | Immigrants from Ethiopia |
| Minimum | 1.2% | 2.8% |
| Maximum | 29.9% | 26.5% |
| Range | 28.7% | 23.7% |
| Mean | 11.3% | 10.7% |
| Median | 9.4% | 9.8% |
| Interquartile 25% (IQ1) | 6.8% | 8.5% |
| Interquartile 75% (IQ3) | 14.4% | 12.3% |
| Interquartile Range (IQR) | 7.6% | 3.8% |
| Standard Deviation (Sample) | 6.8% | 4.5% |
| Standard Deviation (Population) | 6.7% | 4.5% |
Demographics Similar to Carpatho Rusyns and Immigrants from Ethiopia by Receiving Food Stamps
In terms of receiving food stamps, the demographic groups most similar to Carpatho Rusyns are Korean (10.4%, a difference of 0.030%), Immigrants from Pakistan (10.4%, a difference of 0.040%), Pakistani (10.4%, a difference of 0.33%), Romanian (10.4%, a difference of 0.43%), and Mongolian (10.5%, a difference of 0.44%). Similarly, the demographic groups most similar to Immigrants from Ethiopia are Afghan (10.7%, a difference of 0.020%), Ukrainian (10.7%, a difference of 0.16%), Paraguayan (10.7%, a difference of 0.25%), Immigrants from Philippines (10.7%, a difference of 0.46%), and Sri Lankan (10.6%, a difference of 0.71%).
| Demographics | Rating | Rank | Receiving Food Stamps |
| Koreans | 96.3 /100 | #107 | Exceptional 10.4% |
| Carpatho Rusyns | 96.2 /100 | #108 | Exceptional 10.4% |
| Immigrants | Pakistan | 96.2 /100 | #109 | Exceptional 10.4% |
| Pakistanis | 95.9 /100 | #110 | Exceptional 10.4% |
| Romanians | 95.8 /100 | #111 | Exceptional 10.4% |
| Mongolians | 95.8 /100 | #112 | Exceptional 10.5% |
| Icelanders | 95.4 /100 | #113 | Exceptional 10.5% |
| Scotch-Irish | 95.1 /100 | #114 | Exceptional 10.5% |
| Immigrants | Saudi Arabia | 94.9 /100 | #115 | Exceptional 10.5% |
| Canadians | 94.8 /100 | #116 | Exceptional 10.5% |
| Immigrants | Nepal | 94.6 /100 | #117 | Exceptional 10.6% |
| Assyrians/Chaldeans/Syriacs | 94.1 /100 | #118 | Exceptional 10.6% |
| Immigrants | Poland | 93.9 /100 | #119 | Exceptional 10.6% |
| Ethiopians | 93.9 /100 | #120 | Exceptional 10.6% |
| Slavs | 93.8 /100 | #121 | Exceptional 10.6% |
| Sri Lankans | 93.7 /100 | #122 | Exceptional 10.6% |
| Immigrants | Philippines | 93.3 /100 | #123 | Exceptional 10.7% |
| Paraguayans | 93.0 /100 | #124 | Exceptional 10.7% |
| Ukrainians | 92.8 /100 | #125 | Exceptional 10.7% |
| Afghans | 92.6 /100 | #126 | Exceptional 10.7% |
| Immigrants | Ethiopia | 92.6 /100 | #127 | Exceptional 10.7% |