Carpatho Rusyn vs Bahamian In Labor Force | Age 30-34
COMPARE
Carpatho Rusyn
Bahamian
In Labor Force | Age 30-34
In Labor Force | Age 30-34 Comparison
Carpatho Rusyns
Bahamians
86.2%
IN LABOR FORCE | AGE 30-34
100.0/ 100
METRIC RATING
11th/ 347
METRIC RANK
83.9%
IN LABOR FORCE | AGE 30-34
0.6/ 100
METRIC RATING
252nd/ 347
METRIC RANK
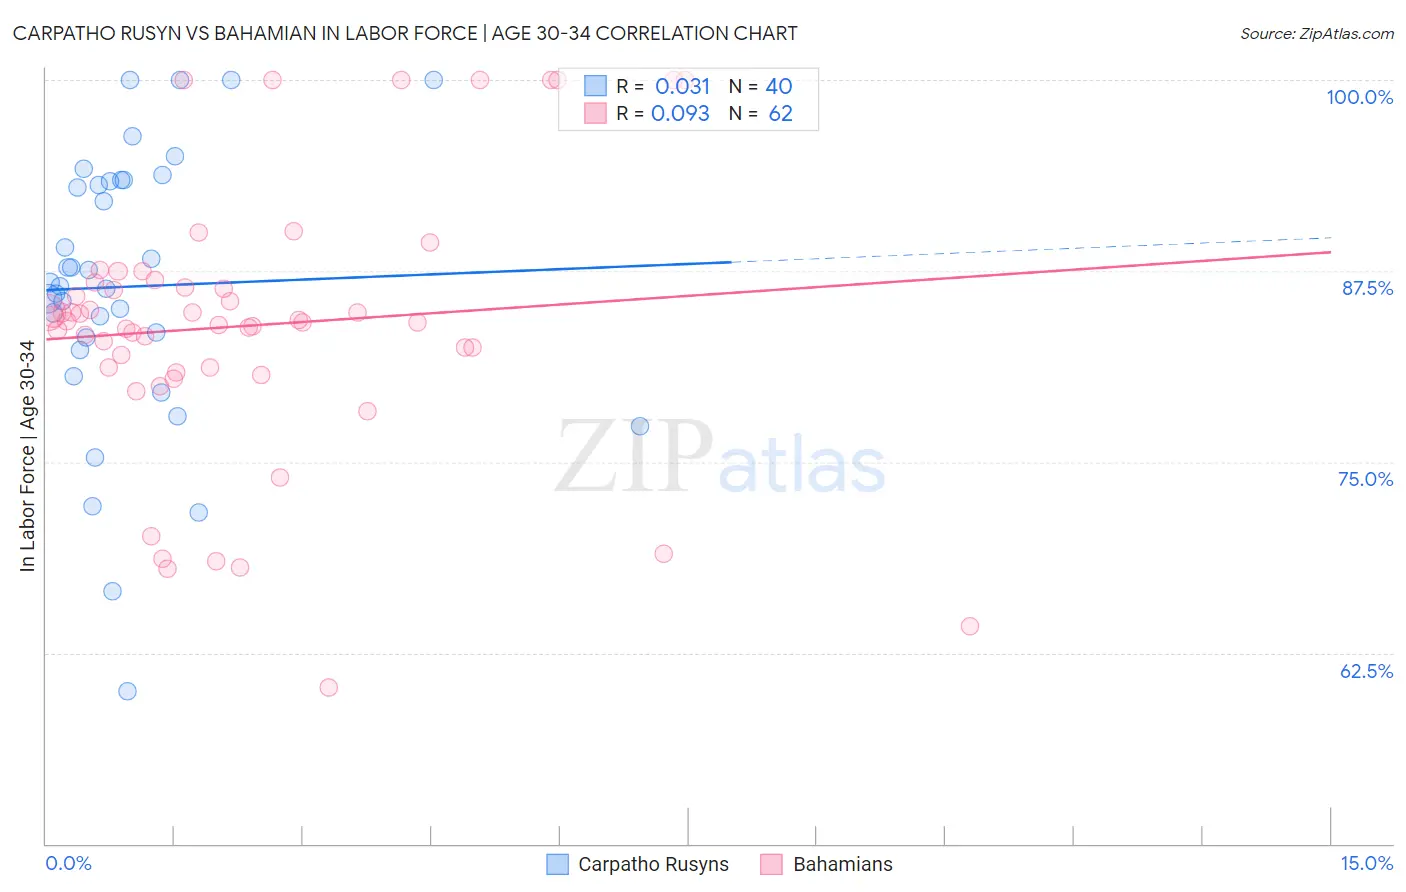
Carpatho Rusyn vs Bahamian In Labor Force | Age 30-34 Correlation Chart
The statistical analysis conducted on geographies consisting of 58,871,401 people shows no correlation between the proportion of Carpatho Rusyns and labor force participation rate among population between the ages 30 and 34 in the United States with a correlation coefficient (R) of 0.031 and weighted average of 86.2%. Similarly, the statistical analysis conducted on geographies consisting of 112,639,396 people shows a slight positive correlation between the proportion of Bahamians and labor force participation rate among population between the ages 30 and 34 in the United States with a correlation coefficient (R) of 0.093 and weighted average of 83.9%, a difference of 2.7%.
In Labor Force | Age 30-34 Correlation Summary
| Measurement | Carpatho Rusyn | Bahamian |
| Minimum | 60.0% | 60.2% |
| Maximum | 100.0% | 100.0% |
| Range | 40.0% | 39.8% |
| Mean | 86.5% | 83.9% |
| Median | 86.6% | 84.2% |
| Interquartile 25% (IQ1) | 82.7% | 81.2% |
| Interquartile 75% (IQ3) | 93.4% | 86.7% |
| Interquartile Range (IQR) | 10.7% | 5.5% |
| Standard Deviation (Sample) | 9.1% | 8.9% |
| Standard Deviation (Population) | 9.0% | 8.8% |
Similar Demographics by In Labor Force | Age 30-34
Demographics Similar to Carpatho Rusyns by In Labor Force | Age 30-34
In terms of in labor force | age 30-34, the demographic groups most similar to Carpatho Rusyns are Immigrants from Serbia (86.2%, a difference of 0.010%), Immigrants from Somalia (86.2%, a difference of 0.040%), Cambodian (86.2%, a difference of 0.060%), Immigrants from Bolivia (86.2%, a difference of 0.070%), and Somali (86.2%, a difference of 0.080%).
| Demographics | Rating | Rank | In Labor Force | Age 30-34 |
| Liberians | 100.0 /100 | #4 | Exceptional 86.4% |
| Immigrants | Ireland | 100.0 /100 | #5 | Exceptional 86.3% |
| Somalis | 100.0 /100 | #6 | Exceptional 86.2% |
| Immigrants | Bolivia | 100.0 /100 | #7 | Exceptional 86.2% |
| Cambodians | 100.0 /100 | #8 | Exceptional 86.2% |
| Immigrants | Somalia | 100.0 /100 | #9 | Exceptional 86.2% |
| Immigrants | Serbia | 100.0 /100 | #10 | Exceptional 86.2% |
| Carpatho Rusyns | 100.0 /100 | #11 | Exceptional 86.2% |
| Bolivians | 100.0 /100 | #12 | Exceptional 86.1% |
| Immigrants | Croatia | 100.0 /100 | #13 | Exceptional 86.1% |
| Immigrants | Cabo Verde | 100.0 /100 | #14 | Exceptional 86.1% |
| Immigrants | Albania | 100.0 /100 | #15 | Exceptional 86.1% |
| Latvians | 100.0 /100 | #16 | Exceptional 86.0% |
| Immigrants | Cameroon | 100.0 /100 | #17 | Exceptional 86.0% |
| Immigrants | Sierra Leone | 100.0 /100 | #18 | Exceptional 86.0% |
Demographics Similar to Bahamians by In Labor Force | Age 30-34
In terms of in labor force | age 30-34, the demographic groups most similar to Bahamians are Nicaraguan (83.9%, a difference of 0.0%), Immigrants from Nicaragua (83.9%, a difference of 0.0%), Immigrants from Iraq (83.9%, a difference of 0.020%), Immigrants from St. Vincent and the Grenadines (83.9%, a difference of 0.020%), and Portuguese (84.0%, a difference of 0.040%).
| Demographics | Rating | Rank | In Labor Force | Age 30-34 |
| Immigrants | Venezuela | 0.9 /100 | #245 | Tragic 84.0% |
| Central Americans | 0.9 /100 | #246 | Tragic 84.0% |
| British West Indians | 0.8 /100 | #247 | Tragic 84.0% |
| Portuguese | 0.8 /100 | #248 | Tragic 84.0% |
| Immigrants | Dominica | 0.7 /100 | #249 | Tragic 84.0% |
| Immigrants | Iraq | 0.7 /100 | #250 | Tragic 83.9% |
| Nicaraguans | 0.6 /100 | #251 | Tragic 83.9% |
| Bahamians | 0.6 /100 | #252 | Tragic 83.9% |
| Immigrants | Nicaragua | 0.6 /100 | #253 | Tragic 83.9% |
| Immigrants | St. Vincent and the Grenadines | 0.5 /100 | #254 | Tragic 83.9% |
| Whites/Caucasians | 0.5 /100 | #255 | Tragic 83.9% |
| Immigrants | Lebanon | 0.4 /100 | #256 | Tragic 83.9% |
| Iraqis | 0.3 /100 | #257 | Tragic 83.8% |
| Hondurans | 0.3 /100 | #258 | Tragic 83.8% |
| Scotch-Irish | 0.3 /100 | #259 | Tragic 83.8% |