Canadian vs Belizean In Labor Force | Age 16-19
COMPARE
Canadian
Belizean
In Labor Force | Age 16-19
In Labor Force | Age 16-19 Comparison
Canadians
Belizeans
40.1%
IN LABOR FORCE | AGE 16-19
100.0/ 100
METRIC RATING
67th/ 347
METRIC RANK
32.8%
IN LABOR FORCE | AGE 16-19
0.0/ 100
METRIC RATING
302nd/ 347
METRIC RANK
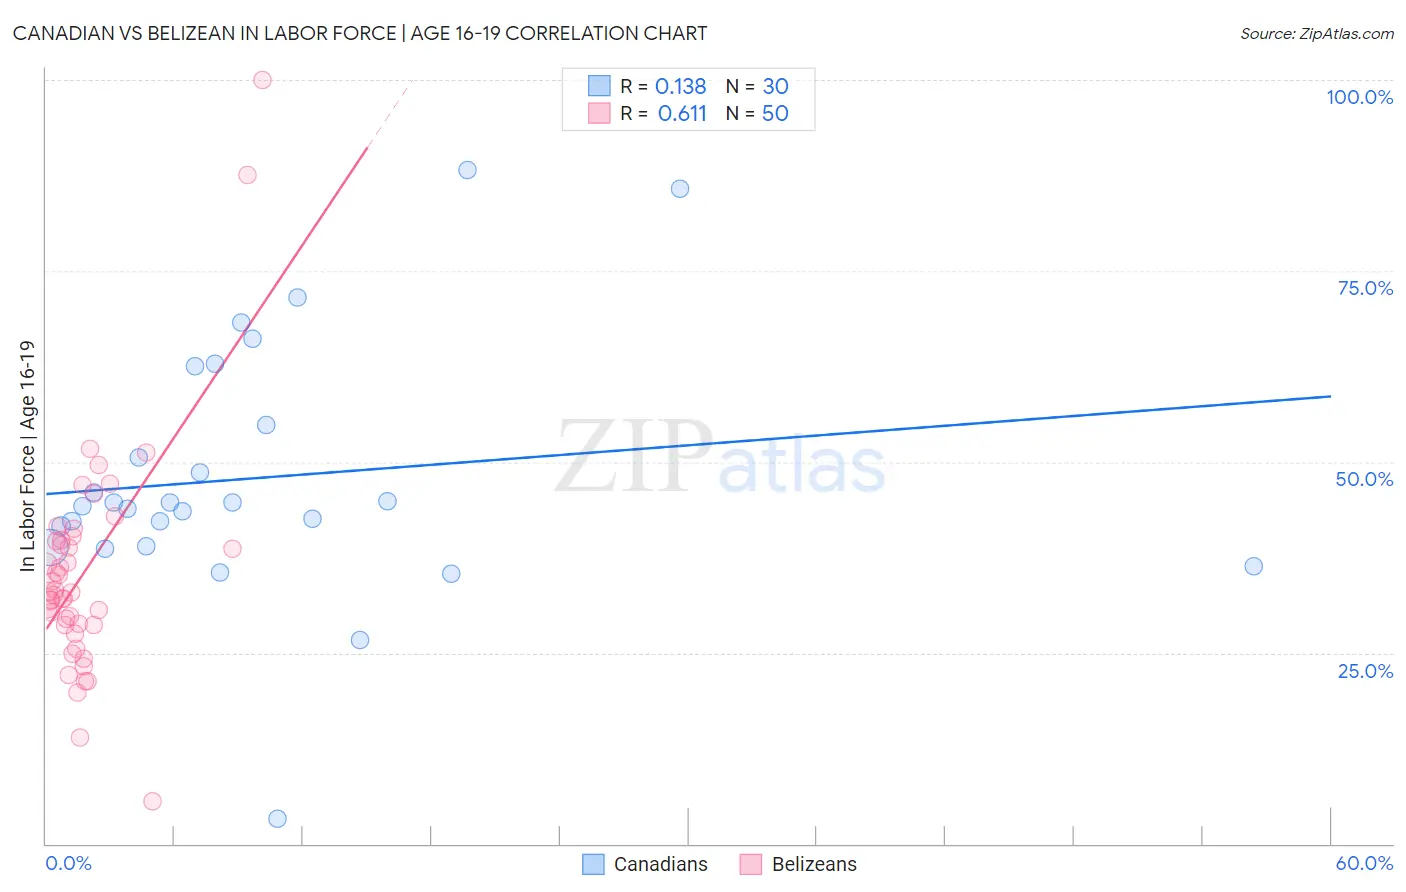
Canadian vs Belizean In Labor Force | Age 16-19 Correlation Chart
The statistical analysis conducted on geographies consisting of 436,563,556 people shows a poor positive correlation between the proportion of Canadians and labor force participation rate among population between the ages 16 and 19 in the United States with a correlation coefficient (R) of 0.138 and weighted average of 40.1%. Similarly, the statistical analysis conducted on geographies consisting of 144,124,652 people shows a significant positive correlation between the proportion of Belizeans and labor force participation rate among population between the ages 16 and 19 in the United States with a correlation coefficient (R) of 0.611 and weighted average of 32.8%, a difference of 22.4%.
In Labor Force | Age 16-19 Correlation Summary
| Measurement | Canadian | Belizean |
| Minimum | 3.2% | 5.5% |
| Maximum | 88.2% | 100.0% |
| Range | 85.0% | 94.5% |
| Mean | 47.9% | 35.7% |
| Median | 44.4% | 32.9% |
| Interquartile 25% (IQ1) | 39.0% | 28.7% |
| Interquartile 75% (IQ3) | 54.8% | 39.8% |
| Interquartile Range (IQR) | 15.8% | 11.2% |
| Standard Deviation (Sample) | 16.8% | 15.2% |
| Standard Deviation (Population) | 16.6% | 15.0% |
Similar Demographics by In Labor Force | Age 16-19
Demographics Similar to Canadians by In Labor Force | Age 16-19
In terms of in labor force | age 16-19, the demographic groups most similar to Canadians are Nonimmigrants (40.1%, a difference of 0.010%), Italian (40.1%, a difference of 0.060%), Kenyan (40.1%, a difference of 0.13%), Potawatomi (40.0%, a difference of 0.13%), and Portuguese (40.0%, a difference of 0.18%).
| Demographics | Rating | Rank | In Labor Force | Age 16-19 |
| Immigrants | Eastern Africa | 100.0 /100 | #60 | Exceptional 40.4% |
| Americans | 100.0 /100 | #61 | Exceptional 40.3% |
| Cherokee | 100.0 /100 | #62 | Exceptional 40.2% |
| Northern Europeans | 100.0 /100 | #63 | Exceptional 40.2% |
| Immigrants | Micronesia | 100.0 /100 | #64 | Exceptional 40.2% |
| Kenyans | 100.0 /100 | #65 | Exceptional 40.1% |
| Immigrants | Nonimmigrants | 100.0 /100 | #66 | Exceptional 40.1% |
| Canadians | 100.0 /100 | #67 | Exceptional 40.1% |
| Italians | 99.9 /100 | #68 | Exceptional 40.1% |
| Potawatomi | 99.9 /100 | #69 | Exceptional 40.0% |
| Portuguese | 99.9 /100 | #70 | Exceptional 40.0% |
| Serbians | 99.9 /100 | #71 | Exceptional 39.9% |
| Iroquois | 99.9 /100 | #72 | Exceptional 39.9% |
| Immigrants | Middle Africa | 99.9 /100 | #73 | Exceptional 39.9% |
| Hungarians | 99.9 /100 | #74 | Exceptional 39.8% |
Demographics Similar to Belizeans by In Labor Force | Age 16-19
In terms of in labor force | age 16-19, the demographic groups most similar to Belizeans are Okinawan (32.8%, a difference of 0.14%), Immigrants from Argentina (32.9%, a difference of 0.38%), Armenian (32.9%, a difference of 0.53%), Iranian (33.0%, a difference of 0.78%), and Immigrants from Dominica (32.5%, a difference of 0.90%).
| Demographics | Rating | Rank | In Labor Force | Age 16-19 |
| Yup'ik | 0.1 /100 | #295 | Tragic 33.3% |
| Jamaicans | 0.1 /100 | #296 | Tragic 33.2% |
| Immigrants | Haiti | 0.1 /100 | #297 | Tragic 33.2% |
| Iranians | 0.0 /100 | #298 | Tragic 33.0% |
| Armenians | 0.0 /100 | #299 | Tragic 32.9% |
| Immigrants | Argentina | 0.0 /100 | #300 | Tragic 32.9% |
| Okinawans | 0.0 /100 | #301 | Tragic 32.8% |
| Belizeans | 0.0 /100 | #302 | Tragic 32.8% |
| Immigrants | Dominica | 0.0 /100 | #303 | Tragic 32.5% |
| Israelis | 0.0 /100 | #304 | Tragic 32.4% |
| Nicaraguans | 0.0 /100 | #305 | Tragic 32.4% |
| Spanish American Indians | 0.0 /100 | #306 | Tragic 32.4% |
| Immigrants | Jamaica | 0.0 /100 | #307 | Tragic 32.2% |
| Navajo | 0.0 /100 | #308 | Tragic 32.1% |
| Immigrants | Eastern Asia | 0.0 /100 | #309 | Tragic 32.0% |