Canadian vs Immigrants from Taiwan In Labor Force | Age 45-54
COMPARE
Canadian
Immigrants from Taiwan
In Labor Force | Age 45-54
In Labor Force | Age 45-54 Comparison
Canadians
Immigrants from Taiwan
82.4%
IN LABOR FORCE | AGE 45-54
15.1/ 100
METRIC RATING
201st/ 347
METRIC RANK
83.5%
IN LABOR FORCE | AGE 45-54
98.0/ 100
METRIC RATING
62nd/ 347
METRIC RANK
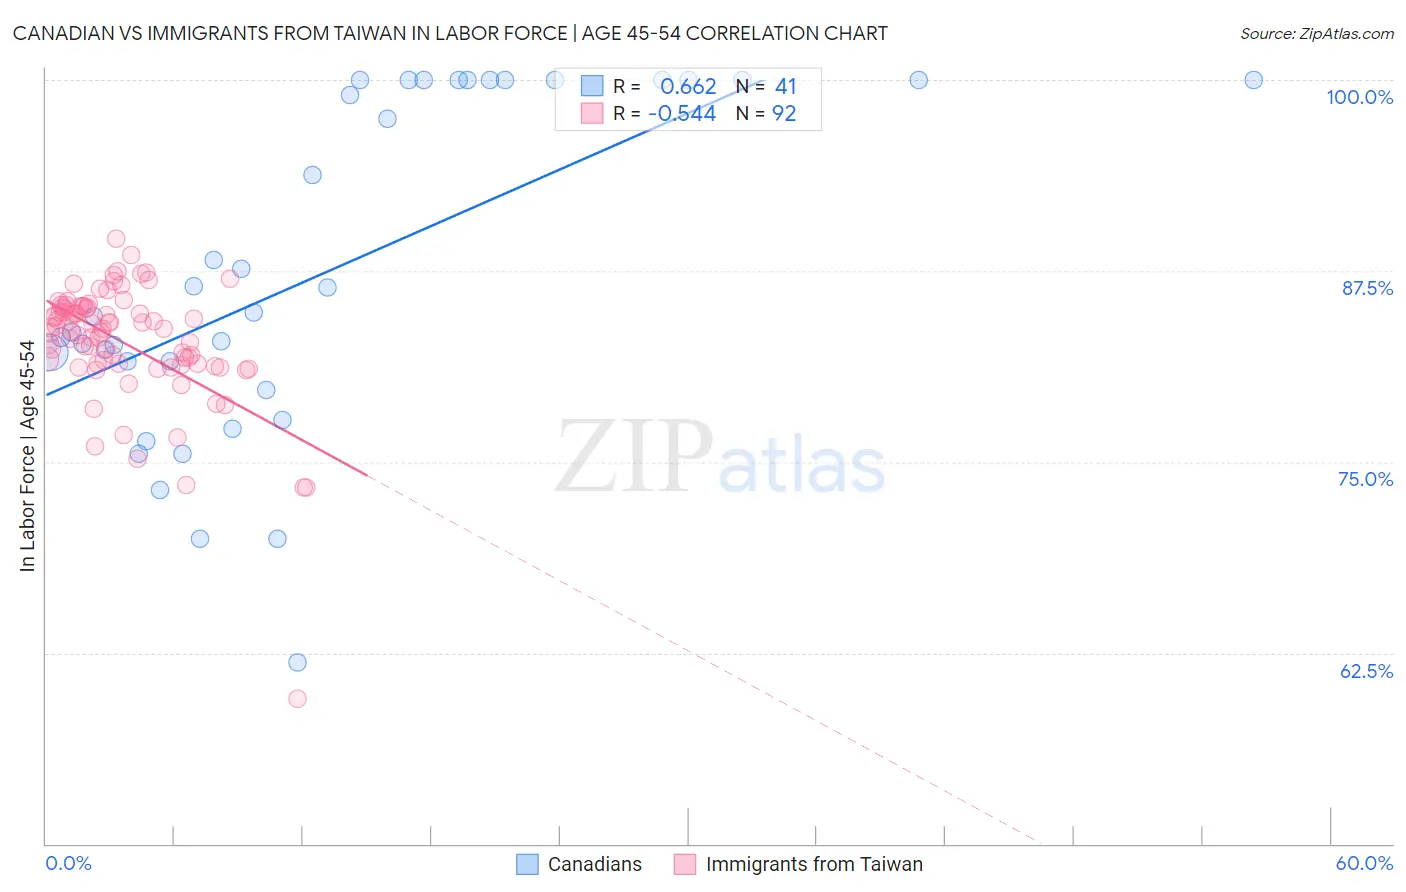
Canadian vs Immigrants from Taiwan In Labor Force | Age 45-54 Correlation Chart
The statistical analysis conducted on geographies consisting of 437,259,773 people shows a significant positive correlation between the proportion of Canadians and labor force participation rate among population between the ages 45 and 54 in the United States with a correlation coefficient (R) of 0.662 and weighted average of 82.4%. Similarly, the statistical analysis conducted on geographies consisting of 298,127,806 people shows a substantial negative correlation between the proportion of Immigrants from Taiwan and labor force participation rate among population between the ages 45 and 54 in the United States with a correlation coefficient (R) of -0.544 and weighted average of 83.5%, a difference of 1.2%.
In Labor Force | Age 45-54 Correlation Summary
| Measurement | Canadian | Immigrants from Taiwan |
| Minimum | 61.9% | 59.5% |
| Maximum | 100.0% | 89.6% |
| Range | 38.1% | 30.1% |
| Mean | 87.5% | 82.8% |
| Median | 84.7% | 83.7% |
| Interquartile 25% (IQ1) | 80.6% | 81.4% |
| Interquartile 75% (IQ3) | 100.0% | 85.1% |
| Interquartile Range (IQR) | 19.4% | 3.7% |
| Standard Deviation (Sample) | 10.8% | 4.0% |
| Standard Deviation (Population) | 10.7% | 4.0% |
Similar Demographics by In Labor Force | Age 45-54
Demographics Similar to Canadians by In Labor Force | Age 45-54
In terms of in labor force | age 45-54, the demographic groups most similar to Canadians are Immigrants from Western Asia (82.4%, a difference of 0.0%), Moroccan (82.5%, a difference of 0.010%), French Canadian (82.5%, a difference of 0.010%), Lebanese (82.5%, a difference of 0.050%), and Immigrants from Denmark (82.5%, a difference of 0.050%).
| Demographics | Rating | Rank | In Labor Force | Age 45-54 |
| Immigrants | Norway | 20.7 /100 | #194 | Fair 82.5% |
| Immigrants | Canada | 20.0 /100 | #195 | Fair 82.5% |
| Immigrants | North America | 18.8 /100 | #196 | Poor 82.5% |
| Lebanese | 18.2 /100 | #197 | Poor 82.5% |
| Immigrants | Denmark | 17.9 /100 | #198 | Poor 82.5% |
| Moroccans | 15.7 /100 | #199 | Poor 82.5% |
| French Canadians | 15.4 /100 | #200 | Poor 82.5% |
| Canadians | 15.1 /100 | #201 | Poor 82.4% |
| Immigrants | Western Asia | 14.9 /100 | #202 | Poor 82.4% |
| Arabs | 11.6 /100 | #203 | Poor 82.4% |
| Immigrants | Western Europe | 10.9 /100 | #204 | Poor 82.4% |
| Senegalese | 9.5 /100 | #205 | Tragic 82.4% |
| Welsh | 9.2 /100 | #206 | Tragic 82.3% |
| Immigrants | Cabo Verde | 8.6 /100 | #207 | Tragic 82.3% |
| Native Hawaiians | 8.5 /100 | #208 | Tragic 82.3% |
Demographics Similar to Immigrants from Taiwan by In Labor Force | Age 45-54
In terms of in labor force | age 45-54, the demographic groups most similar to Immigrants from Taiwan are Afghan (83.5%, a difference of 0.010%), Immigrants from Kenya (83.5%, a difference of 0.010%), Egyptian (83.5%, a difference of 0.020%), Carpatho Rusyn (83.5%, a difference of 0.030%), and Filipino (83.5%, a difference of 0.030%).
| Demographics | Rating | Rank | In Labor Force | Age 45-54 |
| Macedonians | 98.7 /100 | #55 | Exceptional 83.5% |
| Immigrants | Peru | 98.6 /100 | #56 | Exceptional 83.5% |
| Paraguayans | 98.5 /100 | #57 | Exceptional 83.5% |
| Eastern Europeans | 98.5 /100 | #58 | Exceptional 83.5% |
| Bhutanese | 98.3 /100 | #59 | Exceptional 83.5% |
| Carpatho Rusyns | 98.3 /100 | #60 | Exceptional 83.5% |
| Filipinos | 98.3 /100 | #61 | Exceptional 83.5% |
| Immigrants | Taiwan | 98.0 /100 | #62 | Exceptional 83.5% |
| Afghans | 97.9 /100 | #63 | Exceptional 83.5% |
| Immigrants | Kenya | 97.9 /100 | #64 | Exceptional 83.5% |
| Egyptians | 97.9 /100 | #65 | Exceptional 83.5% |
| Asians | 97.7 /100 | #66 | Exceptional 83.4% |
| Chileans | 97.7 /100 | #67 | Exceptional 83.4% |
| Immigrants | Colombia | 97.6 /100 | #68 | Exceptional 83.4% |
| Taiwanese | 97.5 /100 | #69 | Exceptional 83.4% |