Canadian vs Costa Rican Professional Degree
COMPARE
Canadian
Costa Rican
Professional Degree
Professional Degree Comparison
Canadians
Costa Ricans
4.7%
PROFESSIONAL DEGREE
84.4/ 100
METRIC RATING
140th/ 347
METRIC RANK
4.5%
PROFESSIONAL DEGREE
59.9/ 100
METRIC RATING
165th/ 347
METRIC RANK
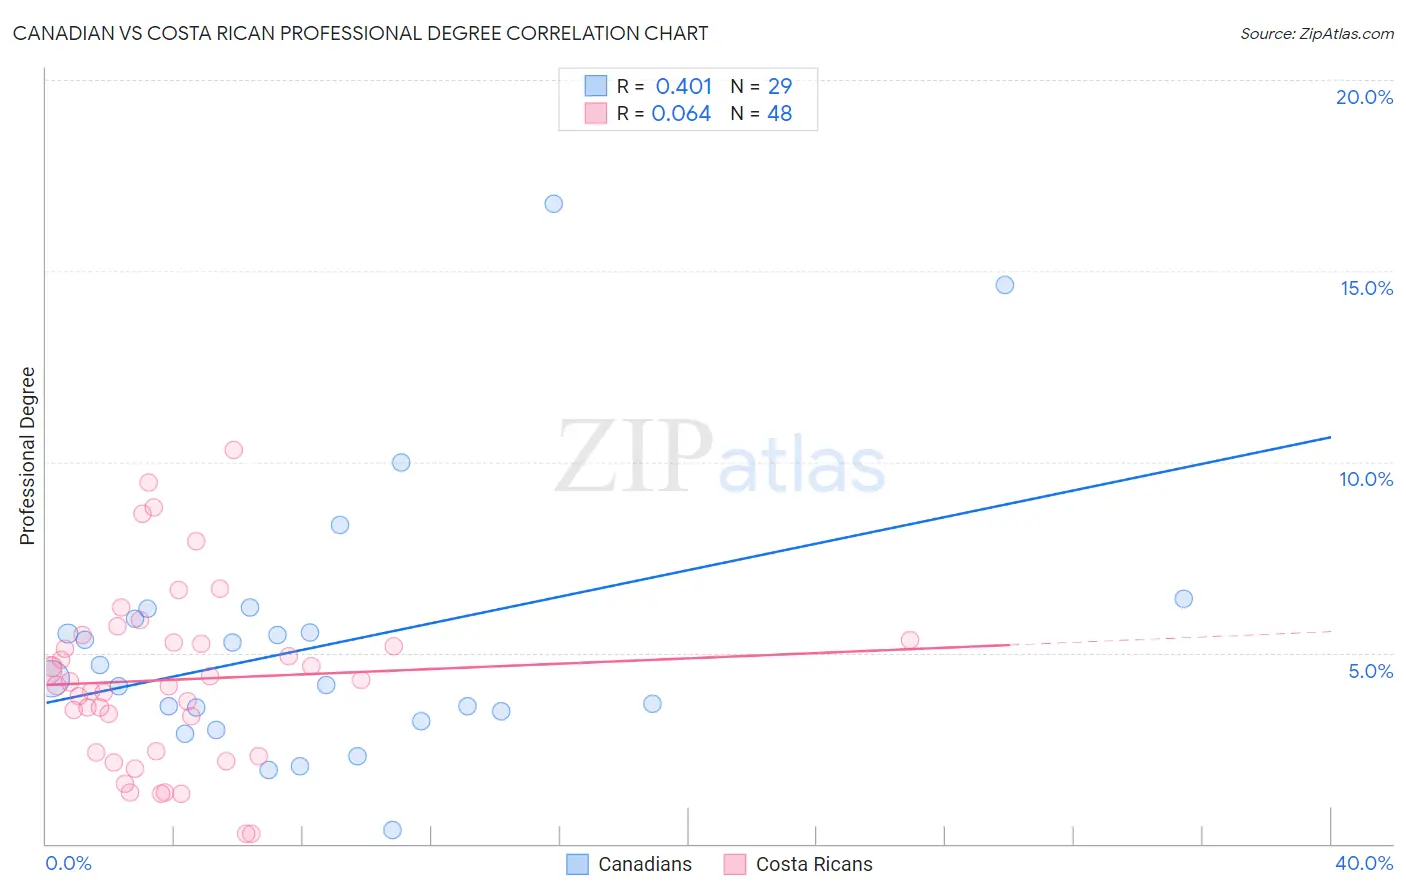
Canadian vs Costa Rican Professional Degree Correlation Chart
The statistical analysis conducted on geographies consisting of 436,022,571 people shows a moderate positive correlation between the proportion of Canadians and percentage of population with at least professional degree education in the United States with a correlation coefficient (R) of 0.401 and weighted average of 4.7%. Similarly, the statistical analysis conducted on geographies consisting of 253,366,674 people shows a slight positive correlation between the proportion of Costa Ricans and percentage of population with at least professional degree education in the United States with a correlation coefficient (R) of 0.064 and weighted average of 4.5%, a difference of 4.6%.
Professional Degree Correlation Summary
| Measurement | Canadian | Costa Rican |
| Minimum | 0.35% | 0.25% |
| Maximum | 16.8% | 10.3% |
| Range | 16.4% | 10.0% |
| Mean | 5.3% | 4.3% |
| Median | 4.3% | 4.2% |
| Interquartile 25% (IQ1) | 3.3% | 2.4% |
| Interquartile 75% (IQ3) | 6.0% | 5.3% |
| Interquartile Range (IQR) | 2.7% | 2.9% |
| Standard Deviation (Sample) | 3.5% | 2.3% |
| Standard Deviation (Population) | 3.4% | 2.3% |
Similar Demographics by Professional Degree
Demographics Similar to Canadians by Professional Degree
In terms of professional degree, the demographic groups most similar to Canadians are South American (4.7%, a difference of 0.34%), Basque (4.6%, a difference of 0.62%), Sudanese (4.6%, a difference of 0.75%), Hungarian (4.6%, a difference of 0.86%), and Immigrants from South America (4.6%, a difference of 0.93%).
| Demographics | Rating | Rank | Professional Degree |
| Italians | 90.2 /100 | #133 | Exceptional 4.8% |
| South American Indians | 89.9 /100 | #134 | Excellent 4.8% |
| Macedonians | 89.8 /100 | #135 | Excellent 4.8% |
| Immigrants | Jordan | 89.0 /100 | #136 | Excellent 4.7% |
| Jordanians | 88.9 /100 | #137 | Excellent 4.7% |
| Afghans | 88.8 /100 | #138 | Excellent 4.7% |
| South Americans | 85.6 /100 | #139 | Excellent 4.7% |
| Canadians | 84.4 /100 | #140 | Excellent 4.7% |
| Basques | 81.8 /100 | #141 | Excellent 4.6% |
| Sudanese | 81.3 /100 | #142 | Excellent 4.6% |
| Hungarians | 80.8 /100 | #143 | Excellent 4.6% |
| Immigrants | South America | 80.5 /100 | #144 | Excellent 4.6% |
| Uruguayans | 80.2 /100 | #145 | Excellent 4.6% |
| Luxembourgers | 78.7 /100 | #146 | Good 4.6% |
| Colombians | 77.7 /100 | #147 | Good 4.6% |
Demographics Similar to Costa Ricans by Professional Degree
In terms of professional degree, the demographic groups most similar to Costa Ricans are Immigrants from Colombia (4.5%, a difference of 0.080%), Immigrants from Afghanistan (4.5%, a difference of 0.11%), Swiss (4.5%, a difference of 0.17%), Immigrants from Sierra Leone (4.5%, a difference of 0.17%), and Chinese (4.5%, a difference of 0.19%).
| Demographics | Rating | Rank | Professional Degree |
| Immigrants | Armenia | 68.8 /100 | #158 | Good 4.5% |
| Vietnamese | 68.4 /100 | #159 | Good 4.5% |
| Immigrants | Senegal | 68.0 /100 | #160 | Good 4.5% |
| Assyrians/Chaldeans/Syriacs | 67.4 /100 | #161 | Good 4.5% |
| Peruvians | 65.2 /100 | #162 | Good 4.5% |
| Sierra Leoneans | 64.3 /100 | #163 | Good 4.5% |
| Swiss | 61.0 /100 | #164 | Good 4.5% |
| Costa Ricans | 59.9 /100 | #165 | Average 4.5% |
| Immigrants | Colombia | 59.4 /100 | #166 | Average 4.5% |
| Immigrants | Afghanistan | 59.2 /100 | #167 | Average 4.5% |
| Immigrants | Sierra Leone | 58.7 /100 | #168 | Average 4.5% |
| Chinese | 58.6 /100 | #169 | Average 4.5% |
| Immigrants | Zaire | 57.4 /100 | #170 | Average 4.5% |
| Immigrants | Bangladesh | 56.0 /100 | #171 | Average 4.4% |
| Spaniards | 52.0 /100 | #172 | Average 4.4% |