Cambodian vs Immigrants from Zaire 12th Grade, No Diploma

COMPARE

Cambodian
Race
Ancestry
AfghanAfricanAlaska NativeAlaskan AthabascanAlbanianAleutAlsatianAmericanApacheArabArapahoArgentineanArmenianAssyrian/Chaldean/SyriacAustralianAustrianBahamianBangladeshiBarbadianBasqueBelgianBelizeanBermudanBhutaneseBlackfeetBolivianBrazilianBritishBritish West IndianBulgarianBurmeseCajunCambodianCanadianCape VerdeanCarpatho RusynCelticCentral AmericanCentral American IndianCherokeeCheyenneChickasawChileanChineseChippewaChoctawColombianColvilleComancheCosta RicanCreeCreekCroatianCrowCubanCypriotCzechCzechoslovakianDanishDelawareDominicanDutchDutch West IndianEastern EuropeanEcuadorianEgyptianEnglishEstonianEthiopianEuropeanFijianFilipinoFinnishFrenchFrench American IndianFrench CanadianGermanGerman RussianGhanaianGreekGuamanian/ChamorroGuatemalanGuyaneseHaitianHmongHonduranHopiHoumaHungarianIcelanderIndian (Asian)IndonesianInupiatIranianIraqiIrishIroquoisIsraeliItalianJamaicanJapaneseJordanianKenyanKiowaKoreanLaotianLatvianLebaneseLiberianLithuanianLumbeeLuxembourgerMacedonianMalaysianMalteseMarshalleseMenomineeMexicanMexican American IndianMongolianMoroccanNative HawaiianNavajoNepaleseNew ZealanderNicaraguanNigerianNorthern EuropeanNorwegianOkinawanOsageOttawaPaiutePakistaniPalestinianPanamanianParaguayanPennsylvania GermanPeruvianPimaPolishPortuguesePotawatomiPuebloPuerto RicanPuget Sound SalishRomanianRussianSalvadoranSamoanScandinavianScotch-IrishScottishSeminoleSenegaleseSerbianShoshoneSierra LeoneanSiouxSlavicSlovakSloveneSomaliSouth AfricanSouth AmericanSouth American IndianSoviet UnionSpaniardSpanishSpanish AmericanSpanish American IndianSri LankanSubsaharan AfricanSudaneseSwedishSwissSyrianTaiwaneseThaiTlingit-HaidaTohono O'OdhamTonganTrinidadian and TobagonianTsimshianTurkishU.S. Virgin IslanderUgandanUkrainianUruguayanUteVenezuelanVietnameseWelshWest IndianYakamaYaquiYugoslavianYumanYup'ikZimbabwean
Immigration
NonimmigrantsImmigrantsAfghanistanAfricaAlbaniaArgentinaArmeniaAsiaAustraliaAustriaBahamasBangladeshBarbadosBelarusBelgiumBelizeBoliviaBosnia and HerzegovinaBrazilBulgariaBurma/MyanmarCabo VerdeCambodiaCameroonCanadaCaribbeanCentral AmericaChileChinaColombiaCongoCosta RicaCroatiaCubaCzechoslovakiaDenmarkDominicaDominican RepublicEastern AfricaEastern AsiaEastern EuropeEcuadorEgyptEl SalvadorEnglandEritreaEthiopiaEuropeFijiFranceGermanyGhanaGreeceGrenadaGuatemalaGuyanaHaitiHondurasHong KongHungaryIndiaIndonesiaIranIraqIrelandIsraelItalyJamaicaJapanJordanKazakhstanKenyaKoreaKuwaitLaosLatin AmericaLatviaLebanonLiberiaLithuaniaMalaysiaMexicoMicronesiaMiddle AfricaMoldovaMoroccoNepalNetherlandsNicaraguaNigeriaNorth AmericaNorth MacedoniaNorthern AfricaNorthern EuropeNorwayOceaniaPakistanPanamaPeruPhilippinesPolandPortugalRomaniaRussiaSaudi ArabiaScotlandSenegalSerbiaSierra LeoneSingaporeSomaliaSouth AfricaSouth AmericaSouth Central AsiaSouth Eastern AsiaSouthern EuropeSpainSri LankaSt. Vincent and the GrenadinesSudanSwedenSwitzerlandSyriaTaiwanThailandTrinidad and TobagoTurkeyUgandaUkraineUruguayUzbekistanVenezuelaVietnamWest IndiesWestern AfricaWestern AsiaWestern EuropeYemenZimbabweAzores
Immigrants from Zaire
Race
Ancestry
AfghanAfricanAlaska NativeAlaskan AthabascanAlbanianAleutAlsatianAmericanApacheArabArapahoArgentineanArmenianAssyrian/Chaldean/SyriacAustralianAustrianBahamianBangladeshiBarbadianBasqueBelgianBelizeanBermudanBhutaneseBlackfeetBolivianBrazilianBritishBritish West IndianBulgarianBurmeseCajunCanadianCape VerdeanCarpatho RusynCelticCentral AmericanCentral American IndianCherokeeCheyenneChickasawChileanChineseChippewaChoctawColombianColvilleComancheCosta RicanCreeCreekCroatianCrowCubanCypriotCzechCzechoslovakianDanishDelawareDominicanDutchDutch West IndianEastern EuropeanEcuadorianEgyptianEnglishEstonianEthiopianEuropeanFijianFilipinoFinnishFrenchFrench American IndianFrench CanadianGermanGerman RussianGhanaianGreekGuamanian/ChamorroGuatemalanGuyaneseHaitianHmongHonduranHopiHoumaHungarianIcelanderIndian (Asian)IndonesianInupiatIranianIraqiIrishIroquoisIsraeliItalianJamaicanJapaneseJordanianKenyanKiowaKoreanLaotianLatvianLebaneseLiberianLithuanianLumbeeLuxembourgerMacedonianMalaysianMalteseMarshalleseMenomineeMexicanMexican American IndianMongolianMoroccanNative HawaiianNavajoNepaleseNew ZealanderNicaraguanNigerianNorthern EuropeanNorwegianOkinawanOsageOttawaPaiutePakistaniPalestinianPanamanianParaguayanPennsylvania GermanPeruvianPimaPolishPortuguesePotawatomiPuebloPuerto RicanPuget Sound SalishRomanianRussianSalvadoranSamoanScandinavianScotch-IrishScottishSeminoleSenegaleseSerbianShoshoneSierra LeoneanSiouxSlavicSlovakSloveneSomaliSouth AfricanSouth AmericanSouth American IndianSoviet UnionSpaniardSpanishSpanish AmericanSpanish American IndianSri LankanSubsaharan AfricanSudaneseSwedishSwissSyrianTaiwaneseThaiTlingit-HaidaTohono O'OdhamTonganTrinidadian and TobagonianTsimshianTurkishU.S. Virgin IslanderUgandanUkrainianUruguayanUteVenezuelanVietnameseWelshWest IndianYakamaYaquiYugoslavianYumanYup'ikZimbabwean
Immigration
NonimmigrantsImmigrantsAfghanistanAfricaAlbaniaArgentinaArmeniaAsiaAustraliaAustriaBahamasBangladeshBarbadosBelarusBelgiumBelizeBoliviaBosnia and HerzegovinaBrazilBulgariaBurma/MyanmarCabo VerdeCambodiaCameroonCanadaCaribbeanCentral AmericaChileChinaColombiaCongoCosta RicaCroatiaCubaCzechoslovakiaDenmarkDominicaDominican RepublicEastern AfricaEastern AsiaEastern EuropeEcuadorEgyptEl SalvadorEnglandEritreaEthiopiaEuropeFijiFranceGermanyGhanaGreeceGrenadaGuatemalaGuyanaHaitiHondurasHong KongHungaryIndiaIndonesiaIranIraqIrelandIsraelItalyJamaicaJapanJordanKazakhstanKenyaKoreaKuwaitLaosLatin AmericaLatviaLebanonLiberiaLithuaniaMalaysiaMexicoMicronesiaMiddle AfricaMoldovaMoroccoNepalNetherlandsNicaraguaNigeriaNorth AmericaNorth MacedoniaNorthern AfricaNorthern EuropeNorwayOceaniaPakistanPanamaPeruPhilippinesPolandPortugalRomaniaRussiaSaudi ArabiaScotlandSenegalSerbiaSierra LeoneSingaporeSomaliaSouth AfricaSouth AmericaSouth Central AsiaSouth Eastern AsiaSouthern EuropeSpainSri LankaSt. Vincent and the GrenadinesSudanSwedenSwitzerlandSyriaTaiwanThailandTrinidad and TobagoTurkeyUgandaUkraineUruguayUzbekistanVenezuelaVietnamWest IndiesWestern AfricaWestern AsiaWestern EuropeYemenZaireZimbabweAzores
12th Grade, No Diploma
Income
Poverty
Unemployment
Labor Participation
Family Structure
Vehicle Availability
Education Level
Disability

12th Grade, No Diploma Comparison

Cambodians

Immigrants from Zaire

Exceptional
Tragic
92.6%
12TH GRADE, NO DIPLOMA
99.3/ 100
METRIC RATING
78th/ 347
METRIC RANK
90.3%
12TH GRADE, NO DIPLOMA
4.6/ 100
METRIC RATING
226th/ 347
METRIC RANK

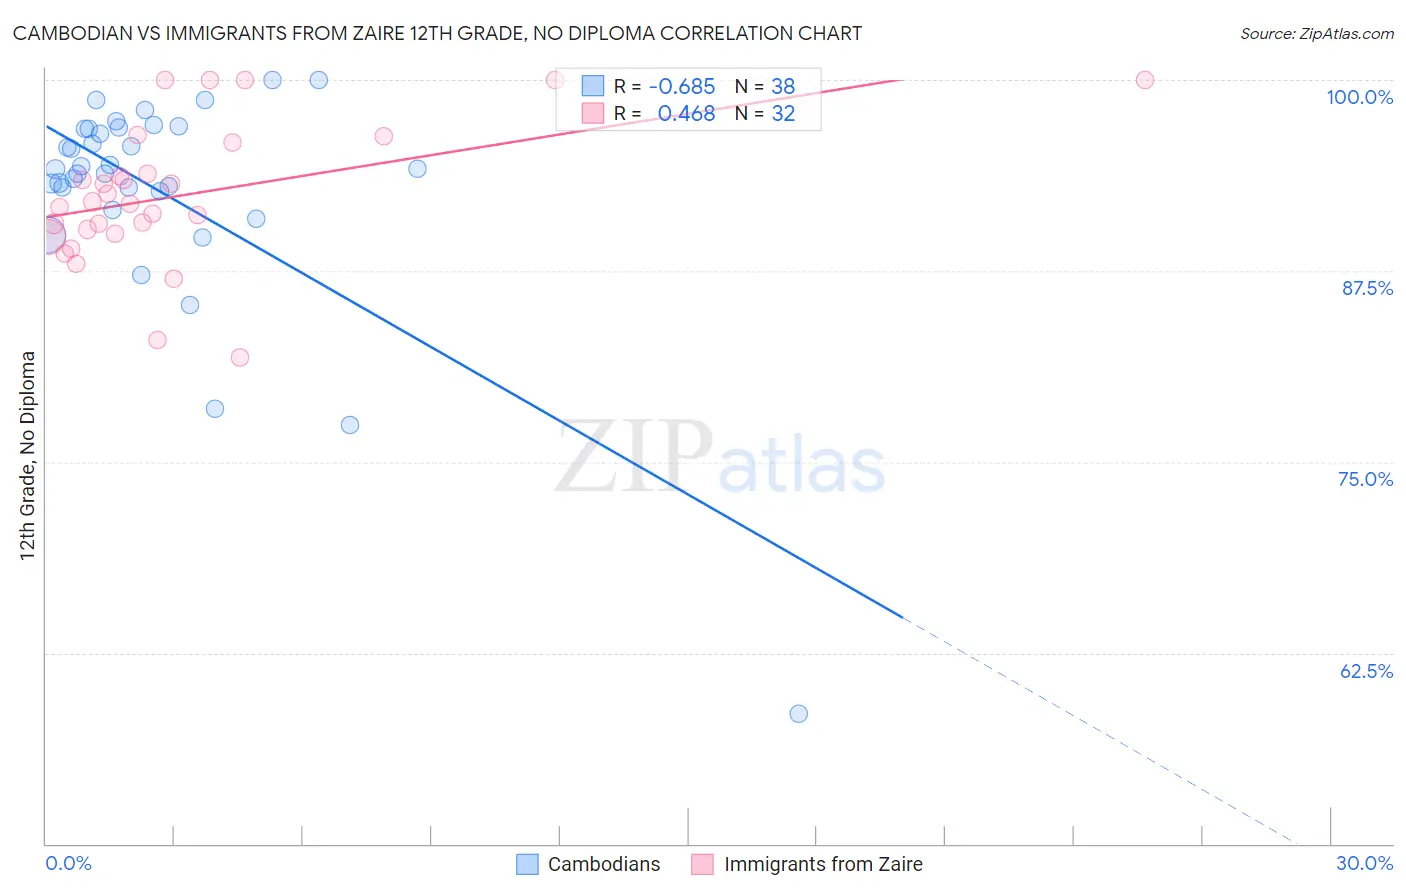
Cambodian vs Immigrants from Zaire 12th Grade, No Diploma Correlation Chart

The statistical analysis conducted on geographies consisting of 102,514,976 people shows a significant negative correlation between the proportion of Cambodians and percentage of population with at least 12th grade (no diploma) education in the United States with a correlation coefficient (R) of -0.685 and weighted average of 92.6%. Similarly, the statistical analysis conducted on geographies consisting of 107,255,805 people shows a moderate positive correlation between the proportion of Immigrants from Zaire and percentage of population with at least 12th grade (no diploma) education in the United States with a correlation coefficient (R) of 0.468 and weighted average of 90.3%, a difference of 2.5%.
Cambodian vs Immigrants from Zaire 12th Grade, No Diploma

12th Grade, No Diploma Correlation Summary

MeasurementCambodianImmigrants from Zaire
Minimum58.5%81.9%
Maximum100.0%100.0%
Range41.5%18.1%
Mean92.7%92.5%
Median94.2%91.9%
Interquartile 25% (IQ1)92.8%90.1%
Interquartile 75% (IQ3)96.8%94.9%
Interquartile Range (IQR)4.0%4.8%
Standard Deviation (Sample)7.5%4.6%
Standard Deviation (Population)7.4%4.5%

Similar Demographics by 12th Grade, No Diploma

Demographics Similar to Cambodians by 12th Grade, No Diploma

In terms of 12th grade, no diploma, the demographic groups most similar to Cambodians are Romanian (92.6%, a difference of 0.0%), French Canadian (92.6%, a difference of 0.020%), Immigrants from England (92.6%, a difference of 0.030%), Immigrants from Denmark (92.5%, a difference of 0.030%), and French (92.6%, a difference of 0.040%).
DemographicsRating | Rank12th Grade, No Diploma
Immigrants | Latvia
99.5
/100
|
#71
Exceptional
92.6%
Immigrants | South Central Asia
99.5
/100
|
#72
Exceptional
92.6%
Burmese
99.4
/100
|
#73
Exceptional
92.6%
Immigrants | Moldova
99.4
/100
|
#74
Exceptional
92.6%
Native Hawaiians
99.4
/100
|
#75
Exceptional
92.6%
French
99.4
/100
|
#76
Exceptional
92.6%
Immigrants | England
99.4
/100
|
#77
Exceptional
92.6%
Cambodians
99.3
/100
|
#78
Exceptional
92.6%
Romanians
99.3
/100
|
#79
Exceptional
92.6%
French Canadians
99.3
/100
|
#80
Exceptional
92.6%
Immigrants | Denmark
99.2
/100
|
#81
Exceptional
92.5%
Immigrants | Switzerland
99.2
/100
|
#82
Exceptional
92.5%
Immigrants | Israel
99.2
/100
|
#83
Exceptional
92.5%
Immigrants | Bulgaria
99.1
/100
|
#84
Exceptional
92.5%
Immigrants | Saudi Arabia
99.0
/100
|
#85
Exceptional
92.5%

Demographics Similar to Immigrants from Zaire by 12th Grade, No Diploma

In terms of 12th grade, no diploma, the demographic groups most similar to Immigrants from Zaire are Immigrants from Panama (90.3%, a difference of 0.010%), Chickasaw (90.3%, a difference of 0.010%), Nigerian (90.3%, a difference of 0.010%), South American (90.3%, a difference of 0.030%), and Immigrants from Somalia (90.4%, a difference of 0.040%).
DemographicsRating | Rank12th Grade, No Diploma
Uruguayans
7.0
/100
|
#219
Tragic
90.4%
Colombians
6.6
/100
|
#220
Tragic
90.4%
Immigrants | Liberia
5.7
/100
|
#221
Tragic
90.4%
Immigrants | Somalia
5.3
/100
|
#222
Tragic
90.4%
South Americans
5.0
/100
|
#223
Tragic
90.3%
Immigrants | Panama
4.8
/100
|
#224
Tragic
90.3%
Chickasaw
4.8
/100
|
#225
Tragic
90.3%
Immigrants | Zaire
4.6
/100
|
#226
Tragic
90.3%
Nigerians
4.5
/100
|
#227
Tragic
90.3%
Creek
3.9
/100
|
#228
Tragic
90.3%
Immigrants | Bahamas
3.6
/100
|
#229
Tragic
90.2%
Immigrants | Philippines
2.8
/100
|
#230
Tragic
90.2%
Peruvians
2.7
/100
|
#231
Tragic
90.2%
Blackfeet
2.4
/100
|
#232
Tragic
90.1%
Immigrants | Thailand
2.3
/100
|
#233
Tragic
90.1%