Immigrants from Middle Africa vs Immigrants from Belize In Labor Force | Age 20-24
COMPARE
Immigrants from Middle Africa
Immigrants from Belize
In Labor Force | Age 20-24
In Labor Force | Age 20-24 Comparison
Immigrants from Middle Africa
Immigrants from Belize
76.6%
IN LABOR FORCE | AGE 20-24
99.7/ 100
METRIC RATING
75th/ 347
METRIC RANK
72.8%
IN LABOR FORCE | AGE 20-24
0.0/ 100
METRIC RATING
293rd/ 347
METRIC RANK
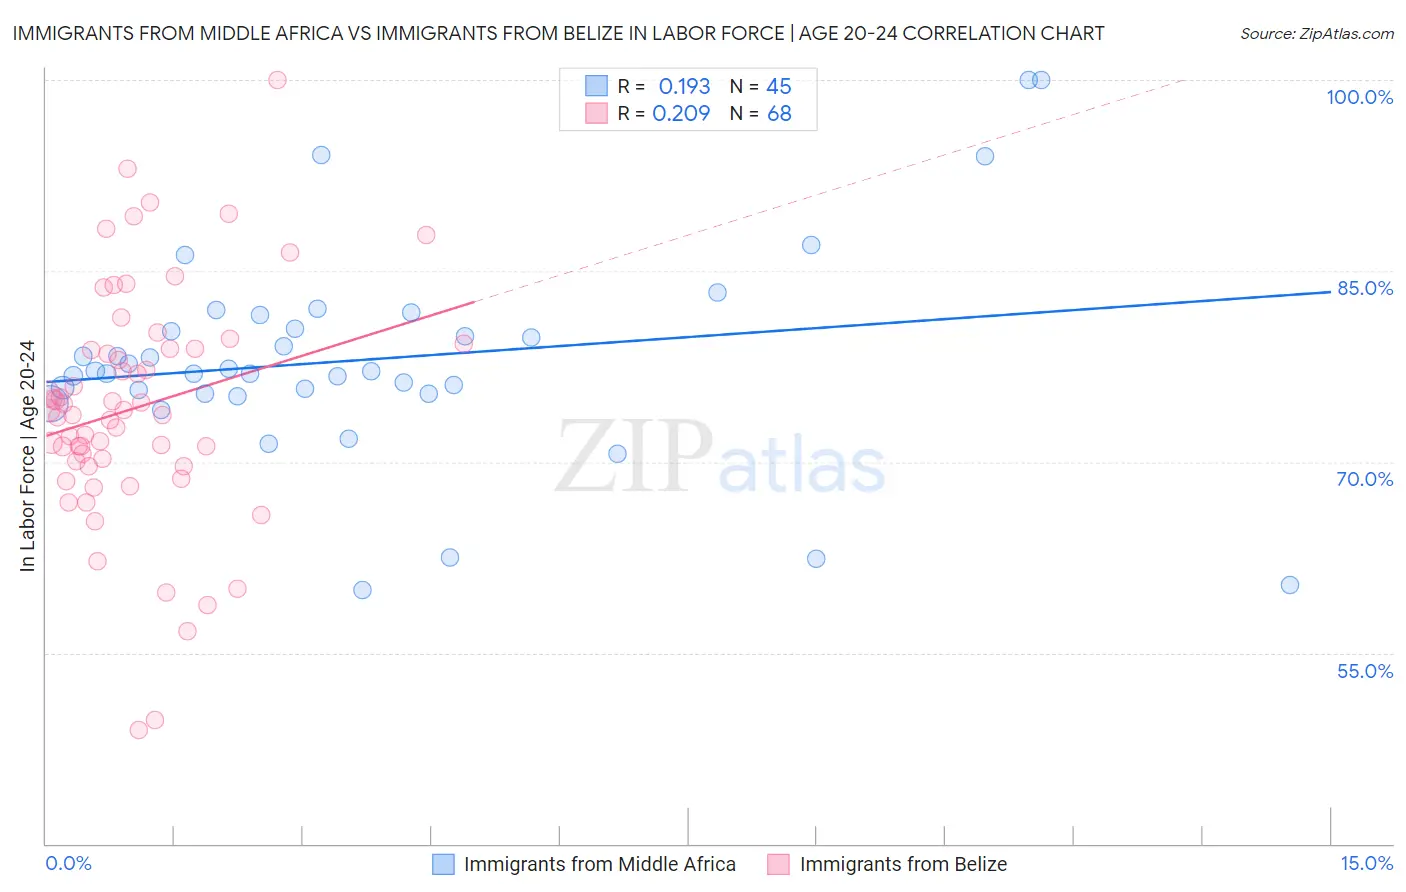
Immigrants from Middle Africa vs Immigrants from Belize In Labor Force | Age 20-24 Correlation Chart
The statistical analysis conducted on geographies consisting of 202,727,179 people shows a poor positive correlation between the proportion of Immigrants from Middle Africa and labor force participation rate among population between the ages 20 and 24 in the United States with a correlation coefficient (R) of 0.193 and weighted average of 76.6%. Similarly, the statistical analysis conducted on geographies consisting of 130,312,763 people shows a weak positive correlation between the proportion of Immigrants from Belize and labor force participation rate among population between the ages 20 and 24 in the United States with a correlation coefficient (R) of 0.209 and weighted average of 72.8%, a difference of 5.2%.
In Labor Force | Age 20-24 Correlation Summary
| Measurement | Immigrants from Middle Africa | Immigrants from Belize |
| Minimum | 59.9% | 49.0% |
| Maximum | 100.0% | 100.0% |
| Range | 40.1% | 51.0% |
| Mean | 78.1% | 74.2% |
| Median | 77.1% | 73.9% |
| Interquartile 25% (IQ1) | 75.4% | 69.9% |
| Interquartile 75% (IQ3) | 81.0% | 78.9% |
| Interquartile Range (IQR) | 5.6% | 9.0% |
| Standard Deviation (Sample) | 8.4% | 9.3% |
| Standard Deviation (Population) | 8.3% | 9.3% |
Similar Demographics by In Labor Force | Age 20-24
Demographics Similar to Immigrants from Middle Africa by In Labor Force | Age 20-24
In terms of in labor force | age 20-24, the demographic groups most similar to Immigrants from Middle Africa are Cree (76.6%, a difference of 0.020%), Immigrants from Moldova (76.6%, a difference of 0.040%), Immigrants from Cameroon (76.6%, a difference of 0.070%), Canadian (76.6%, a difference of 0.070%), and British (76.7%, a difference of 0.090%).
| Demographics | Rating | Rank | In Labor Force | Age 20-24 |
| French American Indians | 99.8 /100 | #68 | Exceptional 76.8% |
| Immigrants | Sudan | 99.8 /100 | #69 | Exceptional 76.8% |
| Ottawa | 99.8 /100 | #70 | Exceptional 76.8% |
| Northern Europeans | 99.8 /100 | #71 | Exceptional 76.8% |
| Guamanians/Chamorros | 99.8 /100 | #72 | Exceptional 76.7% |
| British | 99.8 /100 | #73 | Exceptional 76.7% |
| Cree | 99.7 /100 | #74 | Exceptional 76.6% |
| Immigrants | Middle Africa | 99.7 /100 | #75 | Exceptional 76.6% |
| Immigrants | Moldova | 99.6 /100 | #76 | Exceptional 76.6% |
| Immigrants | Cameroon | 99.6 /100 | #77 | Exceptional 76.6% |
| Canadians | 99.6 /100 | #78 | Exceptional 76.6% |
| Immigrants | Zaire | 99.6 /100 | #79 | Exceptional 76.6% |
| Italians | 99.6 /100 | #80 | Exceptional 76.5% |
| Basques | 99.5 /100 | #81 | Exceptional 76.5% |
| Hmong | 99.5 /100 | #82 | Exceptional 76.5% |
Demographics Similar to Immigrants from Belize by In Labor Force | Age 20-24
In terms of in labor force | age 20-24, the demographic groups most similar to Immigrants from Belize are Immigrants from Argentina (72.8%, a difference of 0.030%), Pueblo (72.9%, a difference of 0.060%), Okinawan (72.7%, a difference of 0.14%), Jamaican (72.7%, a difference of 0.14%), and Immigrants from Nicaragua (72.9%, a difference of 0.15%).
| Demographics | Rating | Rank | In Labor Force | Age 20-24 |
| Immigrants | Lebanon | 0.1 /100 | #286 | Tragic 73.1% |
| Immigrants | Korea | 0.1 /100 | #287 | Tragic 73.1% |
| Argentineans | 0.1 /100 | #288 | Tragic 73.1% |
| U.S. Virgin Islanders | 0.1 /100 | #289 | Tragic 73.0% |
| Immigrants | Belarus | 0.1 /100 | #290 | Tragic 73.0% |
| Immigrants | Nicaragua | 0.0 /100 | #291 | Tragic 72.9% |
| Pueblo | 0.0 /100 | #292 | Tragic 72.9% |
| Immigrants | Belize | 0.0 /100 | #293 | Tragic 72.8% |
| Immigrants | Argentina | 0.0 /100 | #294 | Tragic 72.8% |
| Okinawans | 0.0 /100 | #295 | Tragic 72.7% |
| Jamaicans | 0.0 /100 | #296 | Tragic 72.7% |
| Central American Indians | 0.0 /100 | #297 | Tragic 72.7% |
| Israelis | 0.0 /100 | #298 | Tragic 72.6% |
| Iranians | 0.0 /100 | #299 | Tragic 72.6% |
| Armenians | 0.0 /100 | #300 | Tragic 72.5% |