Burmese vs Irish Unemployment Among Women with Children Under 6 years
COMPARE
Burmese
Irish
Unemployment Among Women with Children Under 6 years
Unemployment Among Women with Children Under 6 years Comparison
Burmese
Irish
6.5%
UNEMPLOYMENT AMONG WOMEN WITH CHILDREN UNDER 6 YEARS
100.0/ 100
METRIC RATING
21st/ 347
METRIC RANK
8.1%
UNEMPLOYMENT AMONG WOMEN WITH CHILDREN UNDER 6 YEARS
2.7/ 100
METRIC RATING
239th/ 347
METRIC RANK
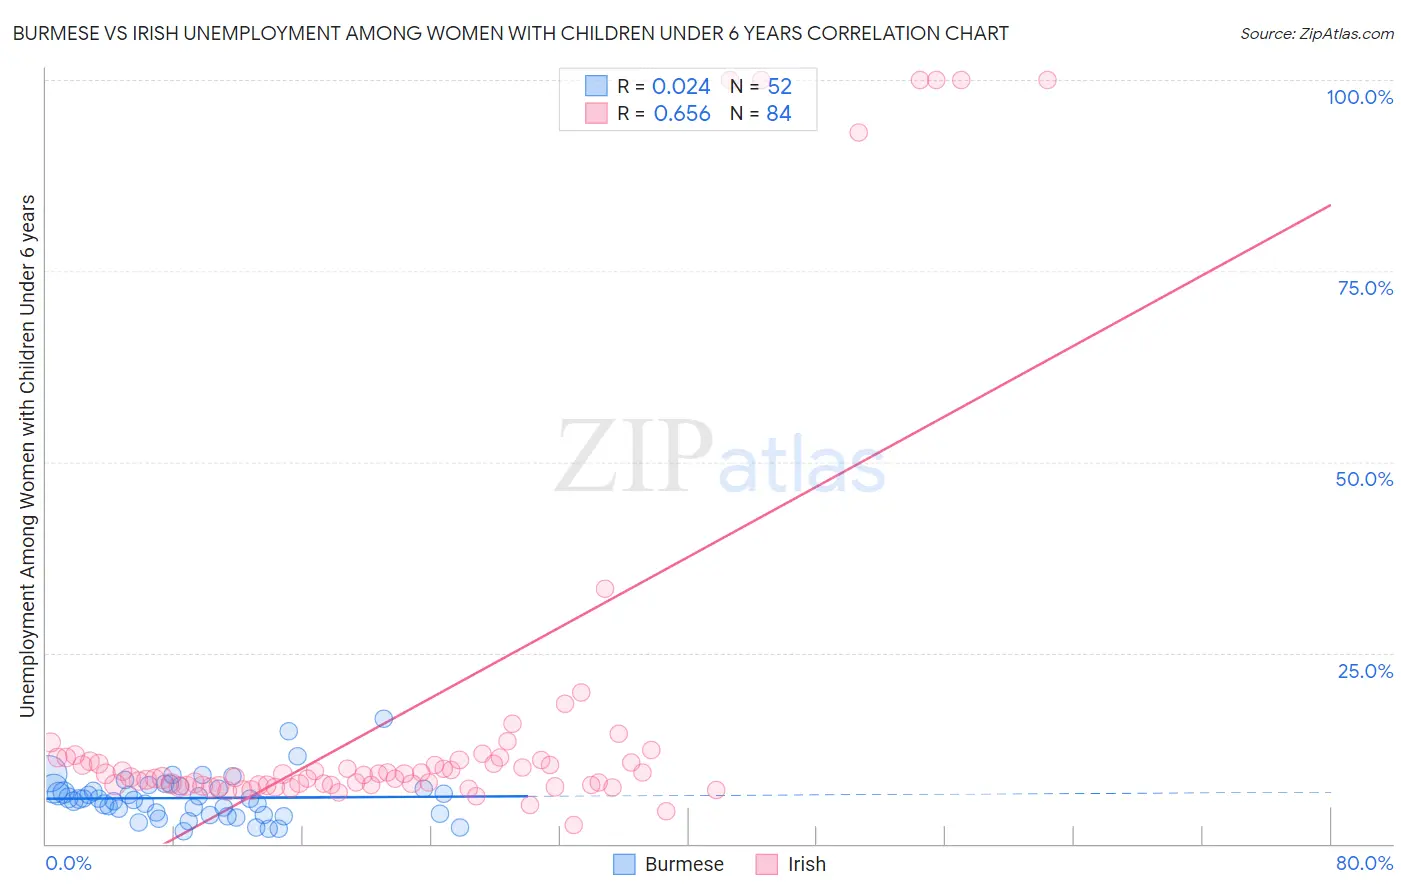
Burmese vs Irish Unemployment Among Women with Children Under 6 years Correlation Chart
The statistical analysis conducted on geographies consisting of 339,459,129 people shows no correlation between the proportion of Burmese and unemployment rate among women with children under the age of 6 in the United States with a correlation coefficient (R) of 0.024 and weighted average of 6.5%. Similarly, the statistical analysis conducted on geographies consisting of 378,985,462 people shows a significant positive correlation between the proportion of Irish and unemployment rate among women with children under the age of 6 in the United States with a correlation coefficient (R) of 0.656 and weighted average of 8.1%, a difference of 24.9%.
Unemployment Among Women with Children Under 6 years Correlation Summary
| Measurement | Burmese | Irish |
| Minimum | 1.7% | 2.5% |
| Maximum | 16.3% | 100.0% |
| Range | 14.6% | 97.5% |
| Mean | 6.0% | 16.9% |
| Median | 5.9% | 9.1% |
| Interquartile 25% (IQ1) | 3.8% | 7.7% |
| Interquartile 75% (IQ3) | 7.2% | 11.0% |
| Interquartile Range (IQR) | 3.4% | 3.3% |
| Standard Deviation (Sample) | 2.9% | 25.2% |
| Standard Deviation (Population) | 2.9% | 25.0% |
Similar Demographics by Unemployment Among Women with Children Under 6 years
Demographics Similar to Burmese by Unemployment Among Women with Children Under 6 years
In terms of unemployment among women with children under 6 years, the demographic groups most similar to Burmese are Ute (6.5%, a difference of 0.050%), Mongolian (6.5%, a difference of 0.10%), Immigrants from Korea (6.5%, a difference of 0.42%), Assyrian/Chaldean/Syriac (6.5%, a difference of 0.43%), and Bulgarian (6.5%, a difference of 0.62%).
| Demographics | Rating | Rank | Unemployment Among Women with Children Under 6 years |
| Immigrants | Bulgaria | 100.0 /100 | #14 | Exceptional 6.3% |
| Thais | 100.0 /100 | #15 | Exceptional 6.3% |
| Immigrants | Uzbekistan | 100.0 /100 | #16 | Exceptional 6.3% |
| Immigrants | Malaysia | 100.0 /100 | #17 | Exceptional 6.4% |
| Assyrians/Chaldeans/Syriacs | 100.0 /100 | #18 | Exceptional 6.5% |
| Mongolians | 100.0 /100 | #19 | Exceptional 6.5% |
| Ute | 100.0 /100 | #20 | Exceptional 6.5% |
| Burmese | 100.0 /100 | #21 | Exceptional 6.5% |
| Immigrants | Korea | 100.0 /100 | #22 | Exceptional 6.5% |
| Bulgarians | 100.0 /100 | #23 | Exceptional 6.5% |
| Laotians | 100.0 /100 | #24 | Exceptional 6.5% |
| Soviet Union | 100.0 /100 | #25 | Exceptional 6.5% |
| Cypriots | 100.0 /100 | #26 | Exceptional 6.5% |
| Immigrants | Japan | 100.0 /100 | #27 | Exceptional 6.5% |
| Immigrants | Israel | 100.0 /100 | #28 | Exceptional 6.5% |
Demographics Similar to Irish by Unemployment Among Women with Children Under 6 years
In terms of unemployment among women with children under 6 years, the demographic groups most similar to Irish are Immigrants from El Salvador (8.1%, a difference of 0.070%), Liberian (8.1%, a difference of 0.10%), Dutch (8.1%, a difference of 0.16%), Immigrants from Middle Africa (8.1%, a difference of 0.26%), and Immigrants from Costa Rica (8.0%, a difference of 0.65%).
| Demographics | Rating | Rank | Unemployment Among Women with Children Under 6 years |
| Welsh | 5.0 /100 | #232 | Tragic 8.0% |
| Immigrants | Trinidad and Tobago | 4.8 /100 | #233 | Tragic 8.0% |
| Kiowa | 4.4 /100 | #234 | Tragic 8.0% |
| Comanche | 4.3 /100 | #235 | Tragic 8.0% |
| Immigrants | Barbados | 4.2 /100 | #236 | Tragic 8.0% |
| Immigrants | Costa Rica | 4.1 /100 | #237 | Tragic 8.0% |
| Immigrants | Middle Africa | 3.2 /100 | #238 | Tragic 8.1% |
| Irish | 2.7 /100 | #239 | Tragic 8.1% |
| Immigrants | El Salvador | 2.6 /100 | #240 | Tragic 8.1% |
| Liberians | 2.6 /100 | #241 | Tragic 8.1% |
| Dutch | 2.5 /100 | #242 | Tragic 8.1% |
| Hawaiians | 1.8 /100 | #243 | Tragic 8.2% |
| French | 1.7 /100 | #244 | Tragic 8.2% |
| Native Hawaiians | 1.7 /100 | #245 | Tragic 8.2% |
| Central Americans | 1.4 /100 | #246 | Tragic 8.2% |