Immigrants from Western Europe vs Immigrants from Trinidad and Tobago In Labor Force | Age 35-44
COMPARE
Immigrants from Western Europe
Immigrants from Trinidad and Tobago
In Labor Force | Age 35-44
In Labor Force | Age 35-44 Comparison
Immigrants from Western Europe
Immigrants from Trinidad and Tobago
84.2%
IN LABOR FORCE | AGE 35-44
24.7/ 100
METRIC RATING
197th/ 347
METRIC RANK
84.4%
IN LABOR FORCE | AGE 35-44
50.7/ 100
METRIC RATING
173rd/ 347
METRIC RANK
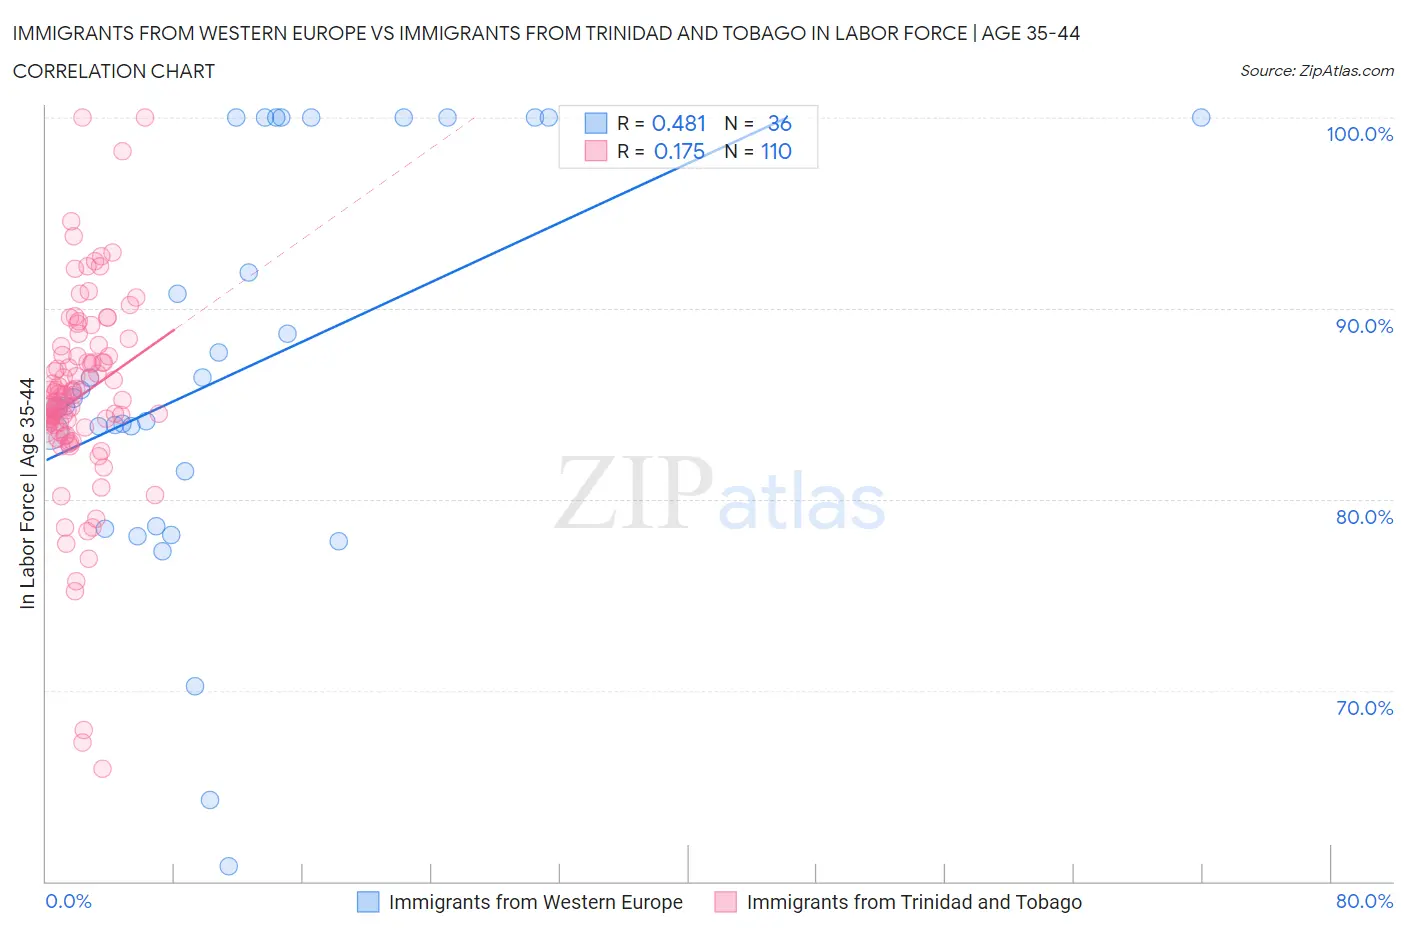
Immigrants from Western Europe vs Immigrants from Trinidad and Tobago In Labor Force | Age 35-44 Correlation Chart
The statistical analysis conducted on geographies consisting of 493,820,556 people shows a moderate positive correlation between the proportion of Immigrants from Western Europe and labor force participation rate among population between the ages 35 and 44 in the United States with a correlation coefficient (R) of 0.481 and weighted average of 84.2%. Similarly, the statistical analysis conducted on geographies consisting of 223,496,330 people shows a poor positive correlation between the proportion of Immigrants from Trinidad and Tobago and labor force participation rate among population between the ages 35 and 44 in the United States with a correlation coefficient (R) of 0.175 and weighted average of 84.4%, a difference of 0.18%.
In Labor Force | Age 35-44 Correlation Summary
| Measurement | Immigrants from Western Europe | Immigrants from Trinidad and Tobago |
| Minimum | 60.8% | 65.9% |
| Maximum | 100.0% | 100.0% |
| Range | 39.2% | 34.1% |
| Mean | 86.7% | 85.4% |
| Median | 85.1% | 85.2% |
| Interquartile 25% (IQ1) | 80.1% | 83.8% |
| Interquartile 75% (IQ3) | 100.0% | 87.5% |
| Interquartile Range (IQR) | 19.9% | 3.7% |
| Standard Deviation (Sample) | 10.4% | 5.3% |
| Standard Deviation (Population) | 10.3% | 5.3% |
Similar Demographics by In Labor Force | Age 35-44
Demographics Similar to Immigrants from Western Europe by In Labor Force | Age 35-44
In terms of in labor force | age 35-44, the demographic groups most similar to Immigrants from Western Europe are Immigrants from England (84.2%, a difference of 0.0%), Immigrants from Indonesia (84.2%, a difference of 0.010%), Immigrants from Caribbean (84.2%, a difference of 0.010%), Ecuadorian (84.2%, a difference of 0.010%), and Syrian (84.2%, a difference of 0.010%).
| Demographics | Rating | Rank | In Labor Force | Age 35-44 |
| Portuguese | 31.9 /100 | #190 | Fair 84.3% |
| Immigrants | Philippines | 27.9 /100 | #191 | Fair 84.2% |
| Immigrants | Vietnam | 27.4 /100 | #192 | Fair 84.2% |
| Hungarians | 26.8 /100 | #193 | Fair 84.2% |
| Immigrants | Indonesia | 25.7 /100 | #194 | Fair 84.2% |
| Immigrants | Caribbean | 25.7 /100 | #195 | Fair 84.2% |
| Immigrants | England | 25.0 /100 | #196 | Fair 84.2% |
| Immigrants | Western Europe | 24.7 /100 | #197 | Fair 84.2% |
| Ecuadorians | 24.0 /100 | #198 | Fair 84.2% |
| Syrians | 23.2 /100 | #199 | Fair 84.2% |
| Moroccans | 23.2 /100 | #200 | Fair 84.2% |
| British | 23.0 /100 | #201 | Fair 84.2% |
| Immigrants | Uzbekistan | 22.8 /100 | #202 | Fair 84.2% |
| Immigrants | South Eastern Asia | 22.4 /100 | #203 | Fair 84.2% |
| Canadians | 19.9 /100 | #204 | Poor 84.2% |
Demographics Similar to Immigrants from Trinidad and Tobago by In Labor Force | Age 35-44
In terms of in labor force | age 35-44, the demographic groups most similar to Immigrants from Trinidad and Tobago are Scandinavian (84.4%, a difference of 0.0%), Immigrants from Iran (84.4%, a difference of 0.0%), Immigrants from Afghanistan (84.4%, a difference of 0.010%), Immigrants from Jordan (84.4%, a difference of 0.010%), and Jordanian (84.4%, a difference of 0.010%).
| Demographics | Rating | Rank | In Labor Force | Age 35-44 |
| Alsatians | 55.2 /100 | #166 | Average 84.4% |
| Immigrants | Portugal | 55.2 /100 | #167 | Average 84.4% |
| Irish | 53.1 /100 | #168 | Average 84.4% |
| Immigrants | Afghanistan | 52.7 /100 | #169 | Average 84.4% |
| Immigrants | Jordan | 52.5 /100 | #170 | Average 84.4% |
| Jordanians | 51.7 /100 | #171 | Average 84.4% |
| Scandinavians | 51.2 /100 | #172 | Average 84.4% |
| Immigrants | Trinidad and Tobago | 50.7 /100 | #173 | Average 84.4% |
| Immigrants | Iran | 50.0 /100 | #174 | Average 84.4% |
| Pakistanis | 48.2 /100 | #175 | Average 84.4% |
| Sri Lankans | 47.3 /100 | #176 | Average 84.4% |
| French Canadians | 44.3 /100 | #177 | Average 84.3% |
| Northern Europeans | 44.1 /100 | #178 | Average 84.3% |
| Immigrants | South Africa | 42.8 /100 | #179 | Average 84.3% |
| Danes | 38.8 /100 | #180 | Fair 84.3% |