British West Indian vs Immigrants from North America Householder Income Ages 25 - 44 years
COMPARE
British West Indian
Immigrants from North America
Householder Income Ages 25 - 44 years
Householder Income Ages 25 - 44 years Comparison
British West Indians
Immigrants from North America
$85,565
HOUSEHOLDER INCOME AGES 25 - 44 YEARS
0.7/ 100
METRIC RATING
253rd/ 347
METRIC RANK
$102,407
HOUSEHOLDER INCOME AGES 25 - 44 YEARS
98.7/ 100
METRIC RATING
92nd/ 347
METRIC RANK
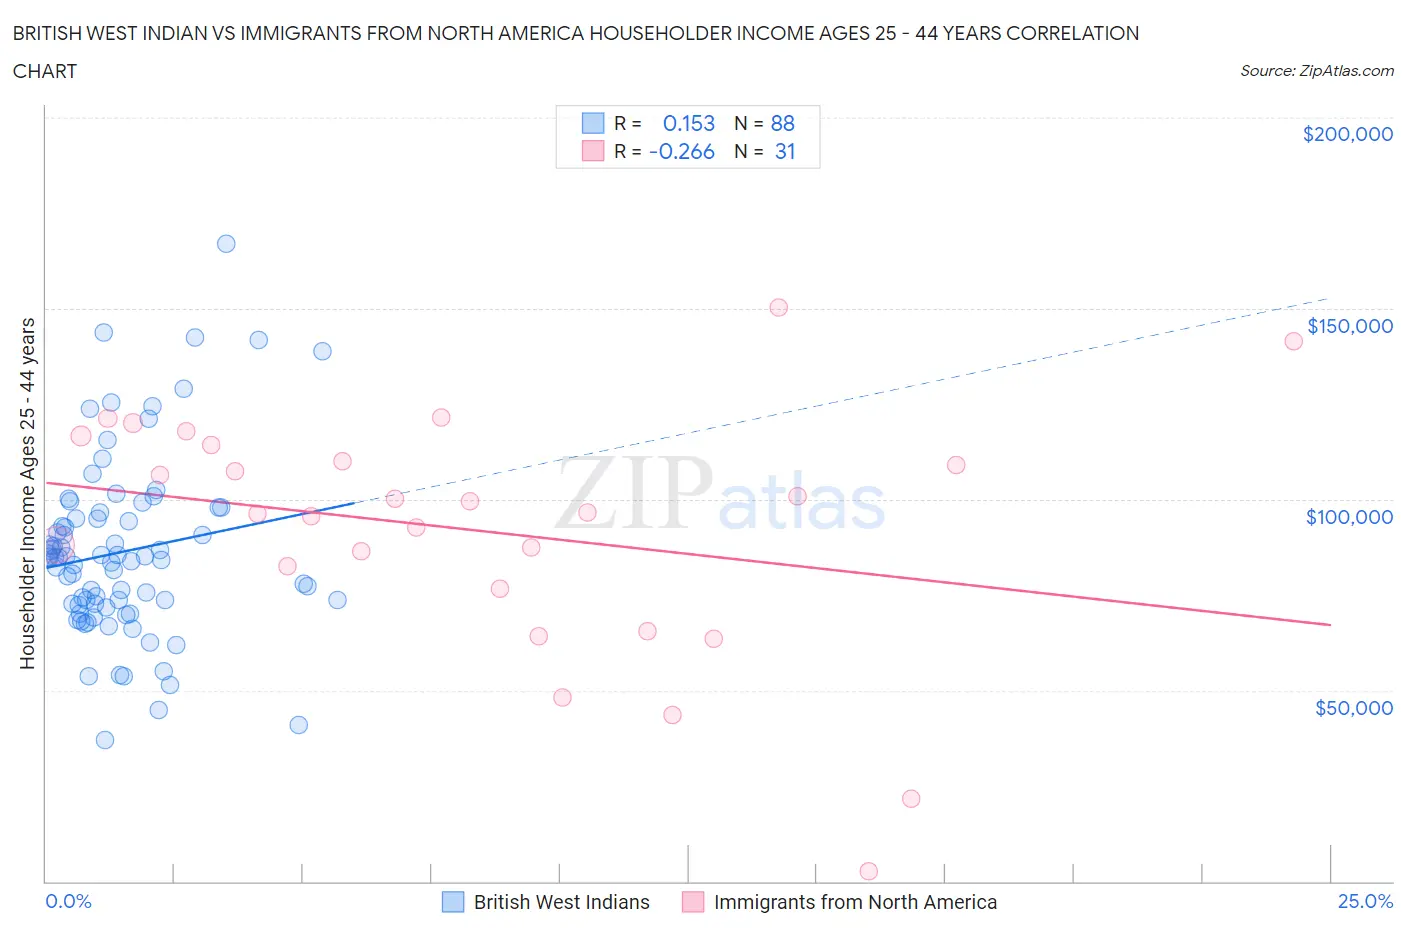
British West Indian vs Immigrants from North America Householder Income Ages 25 - 44 years Correlation Chart
The statistical analysis conducted on geographies consisting of 152,560,295 people shows a poor positive correlation between the proportion of British West Indians and household income with householder between the ages 25 and 44 in the United States with a correlation coefficient (R) of 0.153 and weighted average of $85,565. Similarly, the statistical analysis conducted on geographies consisting of 460,647,822 people shows a weak negative correlation between the proportion of Immigrants from North America and household income with householder between the ages 25 and 44 in the United States with a correlation coefficient (R) of -0.266 and weighted average of $102,407, a difference of 19.7%.
Householder Income Ages 25 - 44 years Correlation Summary
| Measurement | British West Indian | Immigrants from North America |
| Minimum | $36,830 | $2,499 |
| Maximum | $167,054 | $150,179 |
| Range | $130,224 | $147,680 |
| Mean | $86,302 | $91,829 |
| Median | $84,792 | $96,656 |
| Interquartile 25% (IQ1) | $72,493 | $76,535 |
| Interquartile 75% (IQ3) | $95,723 | $114,168 |
| Interquartile Range (IQR) | $23,230 | $37,632 |
| Standard Deviation (Sample) | $23,581 | $32,309 |
| Standard Deviation (Population) | $23,446 | $31,784 |
Similar Demographics by Householder Income Ages 25 - 44 years
Demographics Similar to British West Indians by Householder Income Ages 25 - 44 years
In terms of householder income ages 25 - 44 years, the demographic groups most similar to British West Indians are Immigrants from Laos ($85,553, a difference of 0.010%), Immigrants from Western Africa ($85,676, a difference of 0.13%), Cape Verdean ($85,758, a difference of 0.23%), Pennsylvania German ($85,836, a difference of 0.32%), and French American Indian ($85,899, a difference of 0.39%).
| Demographics | Rating | Rank | Householder Income Ages 25 - 44 years |
| Immigrants | Burma/Myanmar | 1.3 /100 | #246 | Tragic $86,736 |
| Immigrants | Nigeria | 1.2 /100 | #247 | Tragic $86,589 |
| Immigrants | Sudan | 0.9 /100 | #248 | Tragic $86,109 |
| French American Indians | 0.8 /100 | #249 | Tragic $85,899 |
| Pennsylvania Germans | 0.8 /100 | #250 | Tragic $85,836 |
| Cape Verdeans | 0.8 /100 | #251 | Tragic $85,758 |
| Immigrants | Western Africa | 0.7 /100 | #252 | Tragic $85,676 |
| British West Indians | 0.7 /100 | #253 | Tragic $85,565 |
| Immigrants | Laos | 0.7 /100 | #254 | Tragic $85,553 |
| German Russians | 0.6 /100 | #255 | Tragic $85,220 |
| Central Americans | 0.5 /100 | #256 | Tragic $85,144 |
| Mexican American Indians | 0.5 /100 | #257 | Tragic $85,066 |
| Immigrants | Nicaragua | 0.5 /100 | #258 | Tragic $84,914 |
| Immigrants | Senegal | 0.5 /100 | #259 | Tragic $84,848 |
| Americans | 0.4 /100 | #260 | Tragic $84,791 |
Demographics Similar to Immigrants from North America by Householder Income Ages 25 - 44 years
In terms of householder income ages 25 - 44 years, the demographic groups most similar to Immigrants from North America are Croatian ($102,414, a difference of 0.010%), Ukrainian ($102,451, a difference of 0.040%), Romanian ($102,544, a difference of 0.13%), Immigrants from Canada ($102,616, a difference of 0.20%), and Immigrants from Hungary ($102,655, a difference of 0.24%).
| Demographics | Rating | Rank | Householder Income Ages 25 - 44 years |
| Immigrants | Ukraine | 98.9 /100 | #85 | Exceptional $102,664 |
| Immigrants | Hungary | 98.9 /100 | #86 | Exceptional $102,655 |
| Immigrants | Western Europe | 98.9 /100 | #87 | Exceptional $102,654 |
| Immigrants | Canada | 98.9 /100 | #88 | Exceptional $102,616 |
| Romanians | 98.8 /100 | #89 | Exceptional $102,544 |
| Ukrainians | 98.8 /100 | #90 | Exceptional $102,451 |
| Croatians | 98.7 /100 | #91 | Exceptional $102,414 |
| Immigrants | North America | 98.7 /100 | #92 | Exceptional $102,407 |
| Immigrants | England | 98.4 /100 | #93 | Exceptional $102,020 |
| Sri Lankans | 98.4 /100 | #94 | Exceptional $101,960 |
| Assyrians/Chaldeans/Syriacs | 98.3 /100 | #95 | Exceptional $101,936 |
| Macedonians | 98.3 /100 | #96 | Exceptional $101,882 |
| Austrians | 98.3 /100 | #97 | Exceptional $101,842 |
| Immigrants | Kazakhstan | 98.1 /100 | #98 | Exceptional $101,727 |
| Taiwanese | 97.9 /100 | #99 | Exceptional $101,492 |