British West Indian vs Cheyenne Doctorate Degree
COMPARE
British West Indian
Cheyenne
Doctorate Degree
Doctorate Degree Comparison
British West Indians
Cheyenne
1.5%
DOCTORATE DEGREE
0.3/ 100
METRIC RATING
282nd/ 347
METRIC RANK
1.6%
DOCTORATE DEGREE
2.3/ 100
METRIC RATING
241st/ 347
METRIC RANK
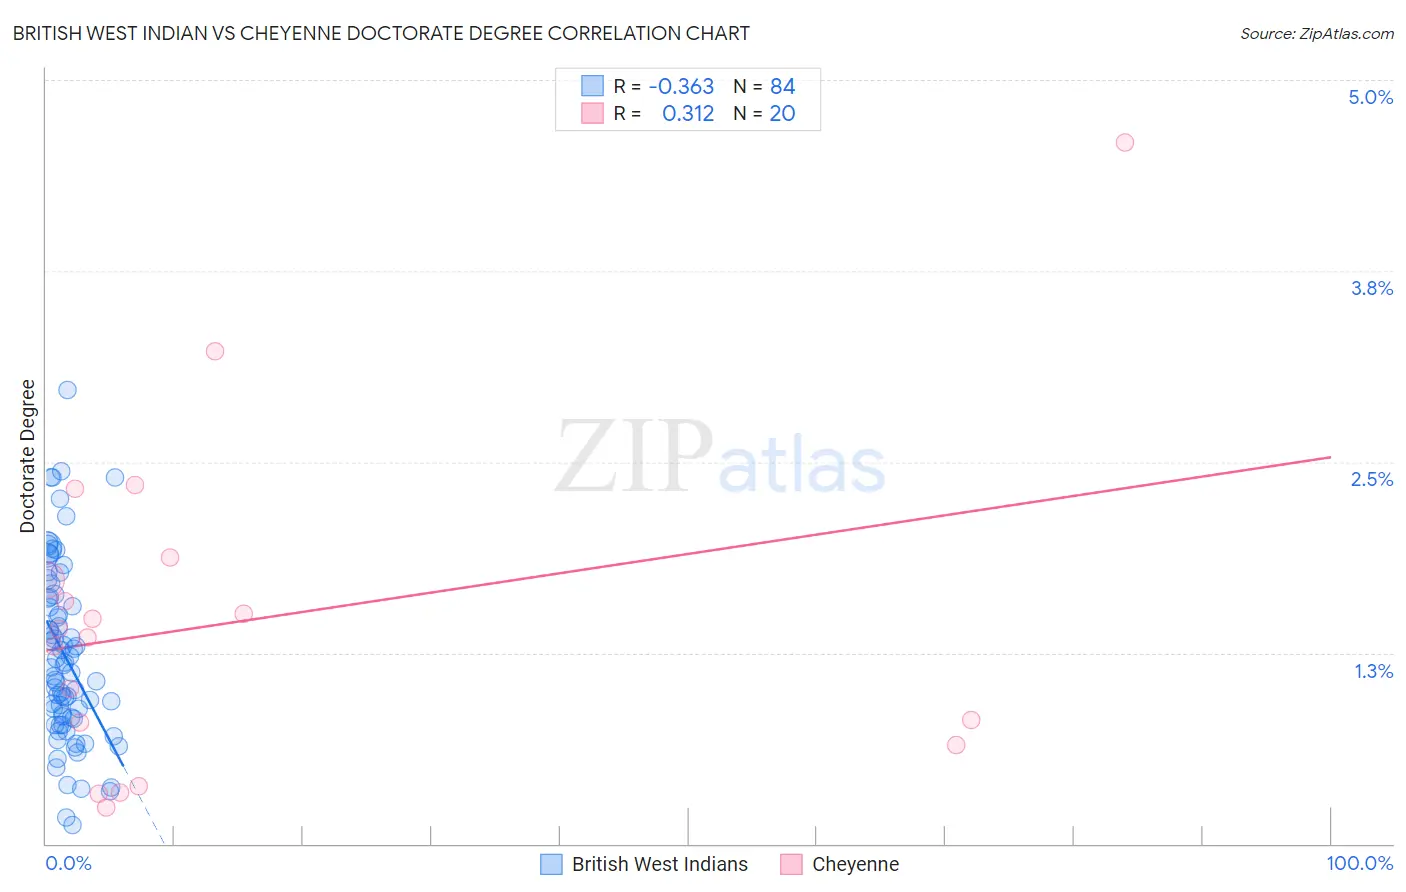
British West Indian vs Cheyenne Doctorate Degree Correlation Chart
The statistical analysis conducted on geographies consisting of 152,241,943 people shows a mild negative correlation between the proportion of British West Indians and percentage of population with at least doctorate degree education in the United States with a correlation coefficient (R) of -0.363 and weighted average of 1.5%. Similarly, the statistical analysis conducted on geographies consisting of 80,230,104 people shows a mild positive correlation between the proportion of Cheyenne and percentage of population with at least doctorate degree education in the United States with a correlation coefficient (R) of 0.312 and weighted average of 1.6%, a difference of 8.8%.
Doctorate Degree Correlation Summary
| Measurement | British West Indian | Cheyenne |
| Minimum | 0.12% | 0.23% |
| Maximum | 3.0% | 4.6% |
| Range | 2.8% | 4.4% |
| Mean | 1.2% | 1.5% |
| Median | 1.1% | 1.4% |
| Interquartile 25% (IQ1) | 0.82% | 0.72% |
| Interquartile 75% (IQ3) | 1.6% | 1.8% |
| Interquartile Range (IQR) | 0.79% | 1.1% |
| Standard Deviation (Sample) | 0.58% | 1.1% |
| Standard Deviation (Population) | 0.58% | 1.0% |
Similar Demographics by Doctorate Degree
Demographics Similar to British West Indians by Doctorate Degree
In terms of doctorate degree, the demographic groups most similar to British West Indians are Tohono O'odham (1.5%, a difference of 0.050%), Central American (1.5%, a difference of 0.050%), Jamaican (1.5%, a difference of 0.090%), Malaysian (1.5%, a difference of 0.11%), and Ecuadorian (1.5%, a difference of 0.12%).
| Demographics | Rating | Rank | Doctorate Degree |
| Aleuts | 0.4 /100 | #275 | Tragic 1.5% |
| Paiute | 0.4 /100 | #276 | Tragic 1.5% |
| Bahamians | 0.4 /100 | #277 | Tragic 1.5% |
| Hawaiians | 0.4 /100 | #278 | Tragic 1.5% |
| Marshallese | 0.4 /100 | #279 | Tragic 1.5% |
| Ecuadorians | 0.4 /100 | #280 | Tragic 1.5% |
| Tohono O'odham | 0.4 /100 | #281 | Tragic 1.5% |
| British West Indians | 0.3 /100 | #282 | Tragic 1.5% |
| Central Americans | 0.3 /100 | #283 | Tragic 1.5% |
| Jamaicans | 0.3 /100 | #284 | Tragic 1.5% |
| Malaysians | 0.3 /100 | #285 | Tragic 1.5% |
| Cherokee | 0.3 /100 | #286 | Tragic 1.5% |
| Cajuns | 0.3 /100 | #287 | Tragic 1.5% |
| Immigrants | El Salvador | 0.3 /100 | #288 | Tragic 1.4% |
| Cape Verdeans | 0.3 /100 | #289 | Tragic 1.4% |
Demographics Similar to Cheyenne by Doctorate Degree
In terms of doctorate degree, the demographic groups most similar to Cheyenne are Immigrants from Panama (1.6%, a difference of 0.19%), Ottawa (1.6%, a difference of 0.21%), Native Hawaiian (1.6%, a difference of 0.34%), West Indian (1.6%, a difference of 0.38%), and Immigrants from Congo (1.6%, a difference of 0.48%).
| Demographics | Rating | Rank | Doctorate Degree |
| Hopi | 3.2 /100 | #234 | Tragic 1.6% |
| Cree | 3.0 /100 | #235 | Tragic 1.6% |
| Indonesians | 2.8 /100 | #236 | Tragic 1.6% |
| Iroquois | 2.7 /100 | #237 | Tragic 1.6% |
| Immigrants | Congo | 2.6 /100 | #238 | Tragic 1.6% |
| West Indians | 2.5 /100 | #239 | Tragic 1.6% |
| Immigrants | Panama | 2.4 /100 | #240 | Tragic 1.6% |
| Cheyenne | 2.3 /100 | #241 | Tragic 1.6% |
| Ottawa | 2.2 /100 | #242 | Tragic 1.6% |
| Native Hawaiians | 2.1 /100 | #243 | Tragic 1.6% |
| French American Indians | 2.0 /100 | #244 | Tragic 1.6% |
| Delaware | 1.9 /100 | #245 | Tragic 1.6% |
| Hmong | 1.8 /100 | #246 | Tragic 1.6% |
| Comanche | 1.8 /100 | #247 | Tragic 1.6% |
| Africans | 1.8 /100 | #248 | Tragic 1.6% |