Iraqi vs Immigrants from Kenya In Labor Force | Age 45-54
COMPARE
Iraqi
Immigrants from Kenya
In Labor Force | Age 45-54
In Labor Force | Age 45-54 Comparison
Iraqis
Immigrants from Kenya
82.2%
IN LABOR FORCE | AGE 45-54
5.6/ 100
METRIC RATING
215th/ 347
METRIC RANK
83.5%
IN LABOR FORCE | AGE 45-54
97.9/ 100
METRIC RATING
64th/ 347
METRIC RANK
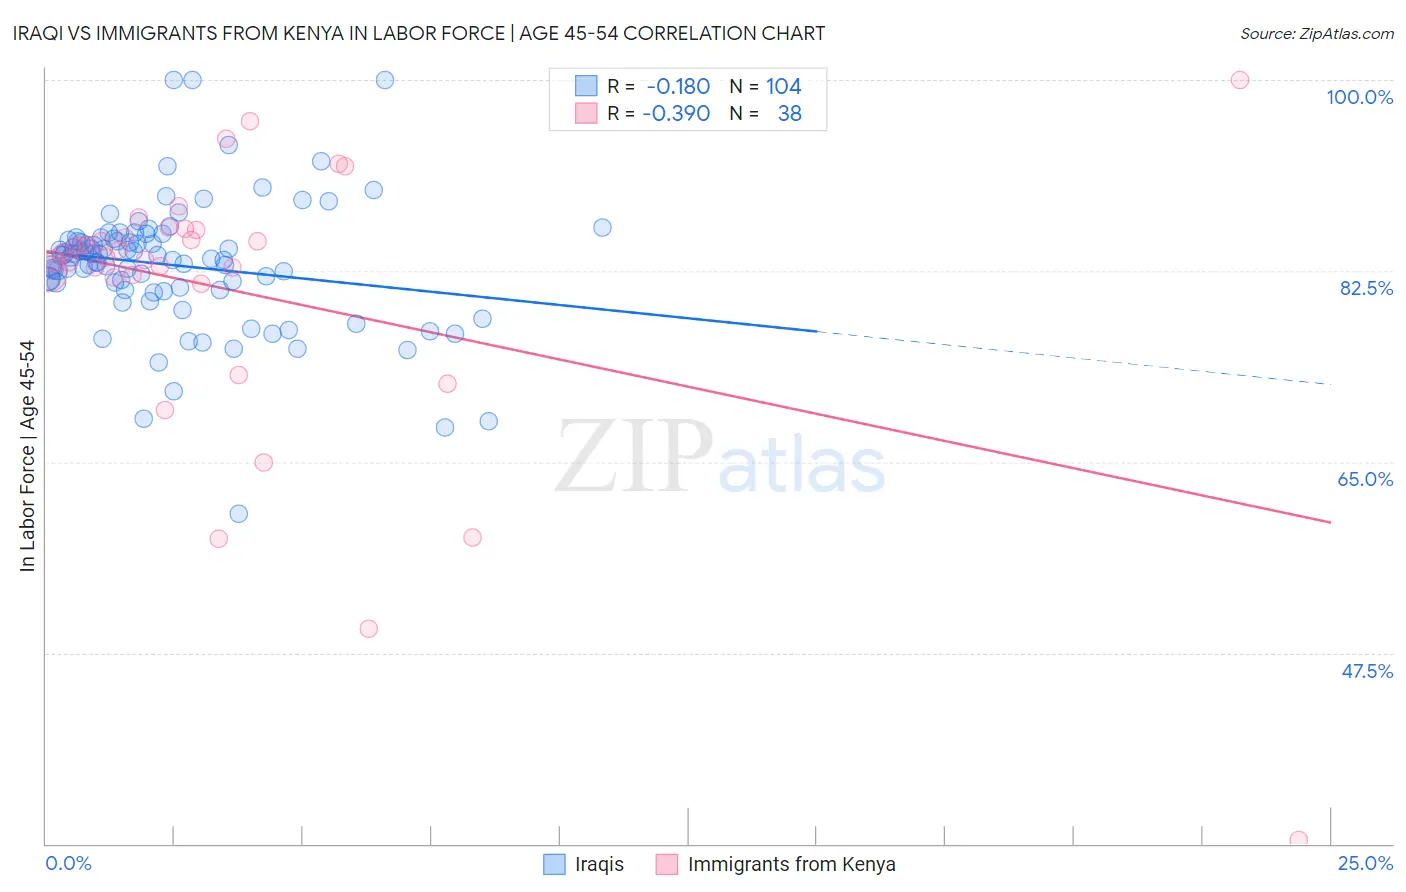
Iraqi vs Immigrants from Kenya In Labor Force | Age 45-54 Correlation Chart
The statistical analysis conducted on geographies consisting of 170,631,505 people shows a poor negative correlation between the proportion of Iraqis and labor force participation rate among population between the ages 45 and 54 in the United States with a correlation coefficient (R) of -0.180 and weighted average of 82.2%. Similarly, the statistical analysis conducted on geographies consisting of 217,994,383 people shows a mild negative correlation between the proportion of Immigrants from Kenya and labor force participation rate among population between the ages 45 and 54 in the United States with a correlation coefficient (R) of -0.390 and weighted average of 83.5%, a difference of 1.5%.
In Labor Force | Age 45-54 Correlation Summary
| Measurement | Iraqi | Immigrants from Kenya |
| Minimum | 60.2% | 30.4% |
| Maximum | 100.0% | 100.0% |
| Range | 39.8% | 69.6% |
| Mean | 83.0% | 80.5% |
| Median | 83.7% | 83.9% |
| Interquartile 25% (IQ1) | 80.9% | 81.9% |
| Interquartile 75% (IQ3) | 85.4% | 86.3% |
| Interquartile Range (IQR) | 4.5% | 4.4% |
| Standard Deviation (Sample) | 5.9% | 13.3% |
| Standard Deviation (Population) | 5.9% | 13.1% |
Similar Demographics by In Labor Force | Age 45-54
Demographics Similar to Iraqis by In Labor Force | Age 45-54
In terms of in labor force | age 45-54, the demographic groups most similar to Iraqis are Immigrants from Panama (82.2%, a difference of 0.0%), Immigrants from Uzbekistan (82.3%, a difference of 0.010%), Scottish (82.2%, a difference of 0.010%), Ecuadorian (82.3%, a difference of 0.030%), and Immigrants from Syria (82.3%, a difference of 0.040%).
| Demographics | Rating | Rank | In Labor Force | Age 45-54 |
| Native Hawaiians | 8.5 /100 | #208 | Tragic 82.3% |
| Immigrants | Lebanon | 7.4 /100 | #209 | Tragic 82.3% |
| Immigrants | Bahamas | 7.1 /100 | #210 | Tragic 82.3% |
| Immigrants | Syria | 6.6 /100 | #211 | Tragic 82.3% |
| Ecuadorians | 6.3 /100 | #212 | Tragic 82.3% |
| Immigrants | Uzbekistan | 5.8 /100 | #213 | Tragic 82.3% |
| Immigrants | Panama | 5.6 /100 | #214 | Tragic 82.2% |
| Iraqis | 5.6 /100 | #215 | Tragic 82.2% |
| Scottish | 5.3 /100 | #216 | Tragic 82.2% |
| Portuguese | 4.7 /100 | #217 | Tragic 82.2% |
| English | 4.4 /100 | #218 | Tragic 82.2% |
| French | 4.1 /100 | #219 | Tragic 82.2% |
| Bahamians | 3.6 /100 | #220 | Tragic 82.2% |
| Panamanians | 3.5 /100 | #221 | Tragic 82.2% |
| Immigrants | Ecuador | 3.4 /100 | #222 | Tragic 82.2% |
Demographics Similar to Immigrants from Kenya by In Labor Force | Age 45-54
In terms of in labor force | age 45-54, the demographic groups most similar to Immigrants from Kenya are Afghan (83.5%, a difference of 0.0%), Egyptian (83.5%, a difference of 0.0%), Immigrants from Taiwan (83.5%, a difference of 0.010%), Asian (83.4%, a difference of 0.020%), and Chilean (83.4%, a difference of 0.020%).
| Demographics | Rating | Rank | In Labor Force | Age 45-54 |
| Paraguayans | 98.5 /100 | #57 | Exceptional 83.5% |
| Eastern Europeans | 98.5 /100 | #58 | Exceptional 83.5% |
| Bhutanese | 98.3 /100 | #59 | Exceptional 83.5% |
| Carpatho Rusyns | 98.3 /100 | #60 | Exceptional 83.5% |
| Filipinos | 98.3 /100 | #61 | Exceptional 83.5% |
| Immigrants | Taiwan | 98.0 /100 | #62 | Exceptional 83.5% |
| Afghans | 97.9 /100 | #63 | Exceptional 83.5% |
| Immigrants | Kenya | 97.9 /100 | #64 | Exceptional 83.5% |
| Egyptians | 97.9 /100 | #65 | Exceptional 83.5% |
| Asians | 97.7 /100 | #66 | Exceptional 83.4% |
| Chileans | 97.7 /100 | #67 | Exceptional 83.4% |
| Immigrants | Colombia | 97.6 /100 | #68 | Exceptional 83.4% |
| Taiwanese | 97.5 /100 | #69 | Exceptional 83.4% |
| Immigrants | Latvia | 97.4 /100 | #70 | Exceptional 83.4% |
| Colombians | 97.3 /100 | #71 | Exceptional 83.4% |