Black/African American vs Spanish American In Labor Force | Age 20-64
COMPARE
Black/African American
Spanish American
In Labor Force | Age 20-64
In Labor Force | Age 20-64 Comparison
Blacks/African Americans
Spanish Americans
76.8%
IN LABOR FORCE | AGE 20-64
0.0/ 100
METRIC RATING
314th/ 347
METRIC RANK
77.8%
IN LABOR FORCE | AGE 20-64
0.0/ 100
METRIC RATING
291st/ 347
METRIC RANK
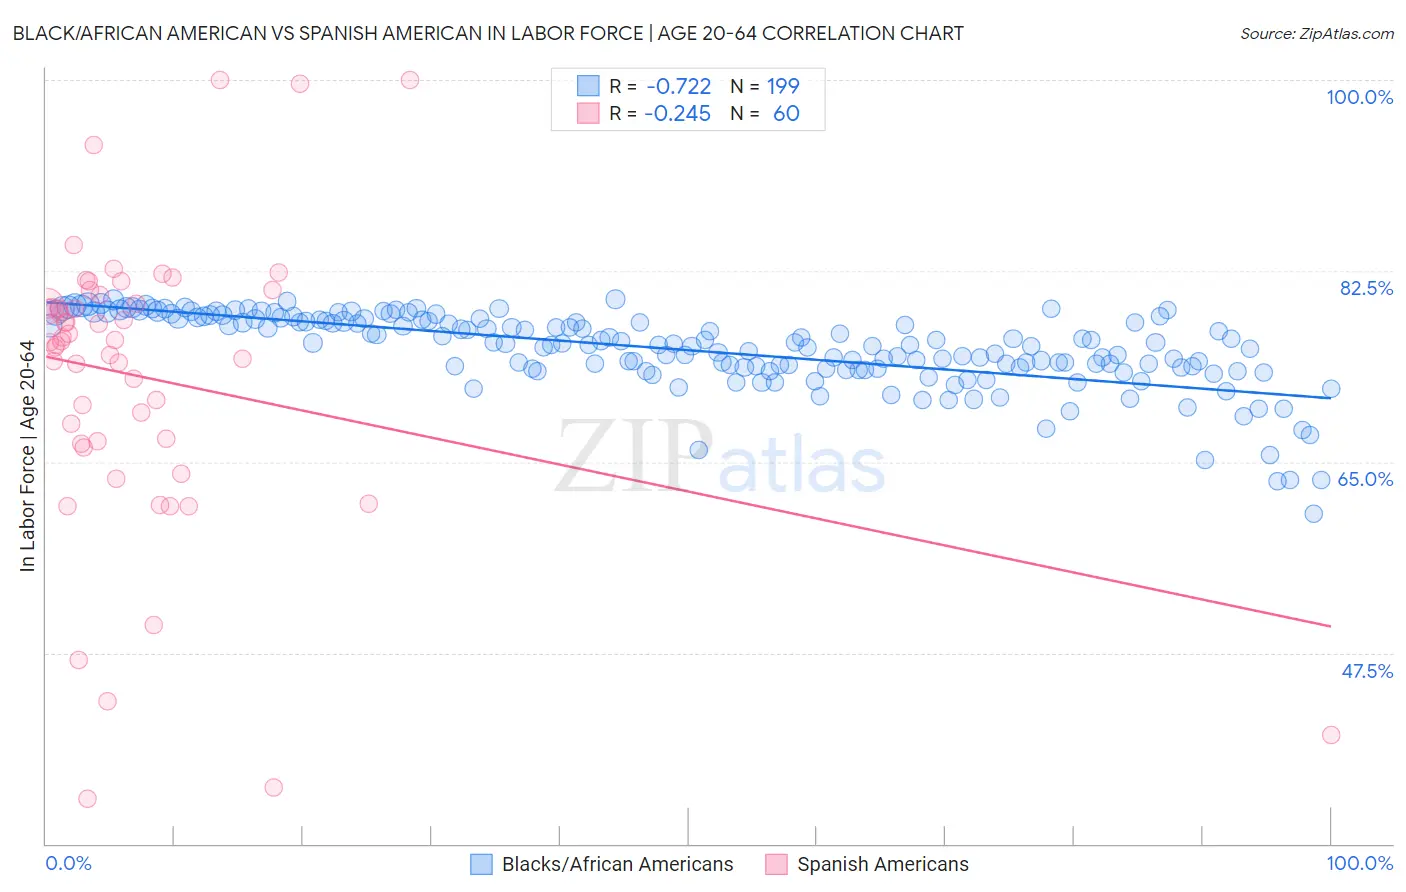
Black/African American vs Spanish American In Labor Force | Age 20-64 Correlation Chart
The statistical analysis conducted on geographies consisting of 566,027,393 people shows a strong negative correlation between the proportion of Blacks/African Americans and labor force participation rate among population between the ages 20 and 64 in the United States with a correlation coefficient (R) of -0.722 and weighted average of 76.8%. Similarly, the statistical analysis conducted on geographies consisting of 103,168,407 people shows a weak negative correlation between the proportion of Spanish Americans and labor force participation rate among population between the ages 20 and 64 in the United States with a correlation coefficient (R) of -0.245 and weighted average of 77.8%, a difference of 1.4%.
In Labor Force | Age 20-64 Correlation Summary
| Measurement | Black/African American | Spanish American |
| Minimum | 60.2% | 34.1% |
| Maximum | 79.9% | 100.0% |
| Range | 19.7% | 65.9% |
| Mean | 75.3% | 72.7% |
| Median | 75.9% | 76.0% |
| Interquartile 25% (IQ1) | 73.6% | 66.8% |
| Interquartile 75% (IQ3) | 78.1% | 79.9% |
| Interquartile Range (IQR) | 4.5% | 13.1% |
| Standard Deviation (Sample) | 3.5% | 13.8% |
| Standard Deviation (Population) | 3.5% | 13.6% |
Similar Demographics by In Labor Force | Age 20-64
Demographics Similar to Blacks/African Americans by In Labor Force | Age 20-64
In terms of in labor force | age 20-64, the demographic groups most similar to Blacks/African Americans are Shoshone (76.8%, a difference of 0.020%), Ottawa (76.7%, a difference of 0.10%), Alaskan Athabascan (76.9%, a difference of 0.14%), Yaqui (76.5%, a difference of 0.29%), and Blackfeet (77.0%, a difference of 0.31%).
| Demographics | Rating | Rank | In Labor Force | Age 20-64 |
| Central American Indians | 0.0 /100 | #307 | Tragic 77.1% |
| Alaska Natives | 0.0 /100 | #308 | Tragic 77.0% |
| Americans | 0.0 /100 | #309 | Tragic 77.0% |
| Comanche | 0.0 /100 | #310 | Tragic 77.0% |
| Blackfeet | 0.0 /100 | #311 | Tragic 77.0% |
| Alaskan Athabascans | 0.0 /100 | #312 | Tragic 76.9% |
| Shoshone | 0.0 /100 | #313 | Tragic 76.8% |
| Blacks/African Americans | 0.0 /100 | #314 | Tragic 76.8% |
| Ottawa | 0.0 /100 | #315 | Tragic 76.7% |
| Yaqui | 0.0 /100 | #316 | Tragic 76.5% |
| Cherokee | 0.0 /100 | #317 | Tragic 76.2% |
| Chickasaw | 0.0 /100 | #318 | Tragic 76.2% |
| Inupiat | 0.0 /100 | #319 | Tragic 76.1% |
| Yakama | 0.0 /100 | #320 | Tragic 75.8% |
| Seminole | 0.0 /100 | #321 | Tragic 75.5% |
Demographics Similar to Spanish Americans by In Labor Force | Age 20-64
In terms of in labor force | age 20-64, the demographic groups most similar to Spanish Americans are Immigrants from Bangladesh (77.9%, a difference of 0.050%), Immigrants from the Azores (77.8%, a difference of 0.050%), African (77.9%, a difference of 0.070%), Hmong (77.9%, a difference of 0.080%), and Delaware (77.8%, a difference of 0.090%).
| Demographics | Rating | Rank | In Labor Force | Age 20-64 |
| Immigrants | Guyana | 0.0 /100 | #284 | Tragic 78.1% |
| Osage | 0.0 /100 | #285 | Tragic 78.0% |
| Immigrants | Belize | 0.0 /100 | #286 | Tragic 78.0% |
| Vietnamese | 0.0 /100 | #287 | Tragic 78.0% |
| Hmong | 0.0 /100 | #288 | Tragic 77.9% |
| Africans | 0.0 /100 | #289 | Tragic 77.9% |
| Immigrants | Bangladesh | 0.0 /100 | #290 | Tragic 77.9% |
| Spanish Americans | 0.0 /100 | #291 | Tragic 77.8% |
| Immigrants | Azores | 0.0 /100 | #292 | Tragic 77.8% |
| Delaware | 0.0 /100 | #293 | Tragic 77.8% |
| Immigrants | Central America | 0.0 /100 | #294 | Tragic 77.7% |
| Immigrants | Grenada | 0.0 /100 | #295 | Tragic 77.7% |
| Immigrants | Dominican Republic | 0.0 /100 | #296 | Tragic 77.7% |
| Dominicans | 0.0 /100 | #297 | Tragic 77.7% |
| Cree | 0.0 /100 | #298 | Tragic 77.7% |