Blackfeet vs Immigrants from Pakistan In Labor Force | Age 45-54
COMPARE
Blackfeet
Immigrants from Pakistan
In Labor Force | Age 45-54
In Labor Force | Age 45-54 Comparison
Blackfeet
Immigrants from Pakistan
80.0%
IN LABOR FORCE | AGE 45-54
0.0/ 100
METRIC RATING
307th/ 347
METRIC RANK
83.8%
IN LABOR FORCE | AGE 45-54
99.7/ 100
METRIC RATING
29th/ 347
METRIC RANK
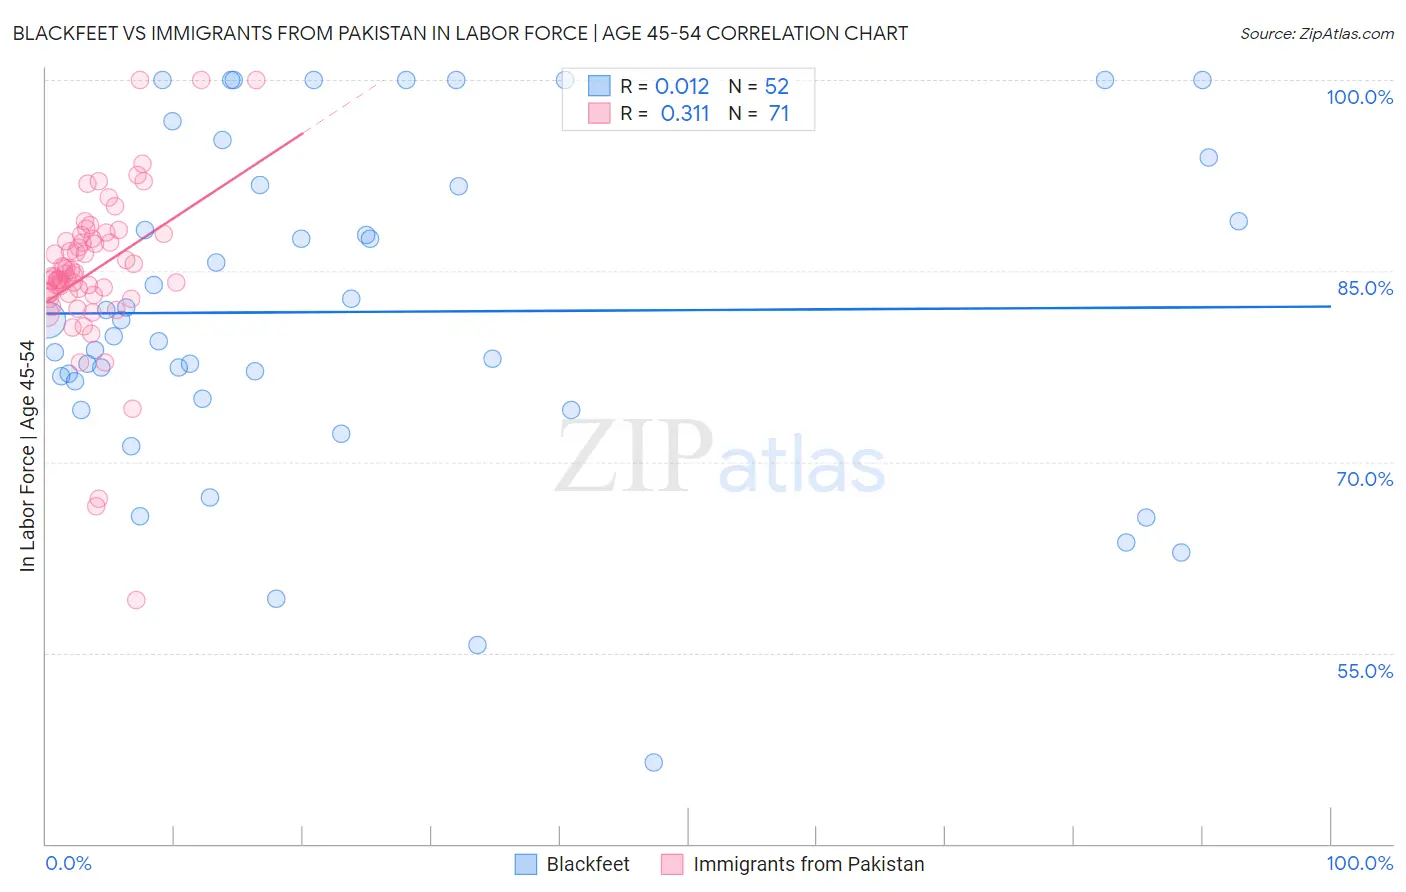
Blackfeet vs Immigrants from Pakistan In Labor Force | Age 45-54 Correlation Chart
The statistical analysis conducted on geographies consisting of 309,460,810 people shows no correlation between the proportion of Blackfeet and labor force participation rate among population between the ages 45 and 54 in the United States with a correlation coefficient (R) of 0.012 and weighted average of 80.0%. Similarly, the statistical analysis conducted on geographies consisting of 283,776,614 people shows a mild positive correlation between the proportion of Immigrants from Pakistan and labor force participation rate among population between the ages 45 and 54 in the United States with a correlation coefficient (R) of 0.311 and weighted average of 83.8%, a difference of 4.8%.
In Labor Force | Age 45-54 Correlation Summary
| Measurement | Blackfeet | Immigrants from Pakistan |
| Minimum | 46.4% | 59.1% |
| Maximum | 100.0% | 100.0% |
| Range | 53.6% | 40.9% |
| Mean | 81.8% | 84.9% |
| Median | 80.5% | 84.7% |
| Interquartile 25% (IQ1) | 75.6% | 83.2% |
| Interquartile 75% (IQ3) | 91.7% | 87.5% |
| Interquartile Range (IQR) | 16.1% | 4.3% |
| Standard Deviation (Sample) | 12.8% | 6.3% |
| Standard Deviation (Population) | 12.7% | 6.3% |
Similar Demographics by In Labor Force | Age 45-54
Demographics Similar to Blackfeet by In Labor Force | Age 45-54
In terms of in labor force | age 45-54, the demographic groups most similar to Blackfeet are Central American Indian (80.0%, a difference of 0.040%), Potawatomi (80.0%, a difference of 0.070%), Spanish American (80.1%, a difference of 0.080%), Hispanic or Latino (80.1%, a difference of 0.12%), and Immigrants from Dominican Republic (80.1%, a difference of 0.12%).
| Demographics | Rating | Rank | In Labor Force | Age 45-54 |
| Fijians | 0.0 /100 | #300 | Tragic 80.2% |
| Spanish American Indians | 0.0 /100 | #301 | Tragic 80.2% |
| Immigrants | Central America | 0.0 /100 | #302 | Tragic 80.2% |
| Immigrants | Azores | 0.0 /100 | #303 | Tragic 80.1% |
| Hispanics or Latinos | 0.0 /100 | #304 | Tragic 80.1% |
| Immigrants | Dominican Republic | 0.0 /100 | #305 | Tragic 80.1% |
| Spanish Americans | 0.0 /100 | #306 | Tragic 80.1% |
| Blackfeet | 0.0 /100 | #307 | Tragic 80.0% |
| Central American Indians | 0.0 /100 | #308 | Tragic 80.0% |
| Potawatomi | 0.0 /100 | #309 | Tragic 80.0% |
| Inupiat | 0.0 /100 | #310 | Tragic 79.9% |
| Mexicans | 0.0 /100 | #311 | Tragic 79.8% |
| Immigrants | Mexico | 0.0 /100 | #312 | Tragic 79.7% |
| Colville | 0.0 /100 | #313 | Tragic 79.5% |
| Ottawa | 0.0 /100 | #314 | Tragic 79.5% |
Demographics Similar to Immigrants from Pakistan by In Labor Force | Age 45-54
In terms of in labor force | age 45-54, the demographic groups most similar to Immigrants from Pakistan are Immigrants from Lithuania (83.9%, a difference of 0.020%), Immigrants from Brazil (83.9%, a difference of 0.030%), Immigrants from Bulgaria (83.8%, a difference of 0.030%), Immigrants from Serbia (83.9%, a difference of 0.040%), and Immigrants from North Macedonia (83.9%, a difference of 0.050%).
| Demographics | Rating | Rank | In Labor Force | Age 45-54 |
| Immigrants | Ireland | 99.8 /100 | #22 | Exceptional 83.9% |
| Tlingit-Haida | 99.8 /100 | #23 | Exceptional 83.9% |
| Slovenes | 99.8 /100 | #24 | Exceptional 83.9% |
| Immigrants | North Macedonia | 99.8 /100 | #25 | Exceptional 83.9% |
| Immigrants | Serbia | 99.8 /100 | #26 | Exceptional 83.9% |
| Immigrants | Brazil | 99.8 /100 | #27 | Exceptional 83.9% |
| Immigrants | Lithuania | 99.8 /100 | #28 | Exceptional 83.9% |
| Immigrants | Pakistan | 99.7 /100 | #29 | Exceptional 83.8% |
| Immigrants | Bulgaria | 99.7 /100 | #30 | Exceptional 83.8% |
| Immigrants | Eritrea | 99.7 /100 | #31 | Exceptional 83.8% |
| Turks | 99.7 /100 | #32 | Exceptional 83.8% |
| Latvians | 99.7 /100 | #33 | Exceptional 83.8% |
| Kenyans | 99.5 /100 | #34 | Exceptional 83.7% |
| Brazilians | 99.5 /100 | #35 | Exceptional 83.7% |
| Ugandans | 99.5 /100 | #36 | Exceptional 83.7% |