Bhutanese vs Houma 4 or more Vehicles in Household
COMPARE
Bhutanese
Houma
4 or more Vehicles in Household
4 or more Vehicles in Household Comparison
Bhutanese
Houma
7.8%
4 OR MORE VEHICLES IN HOUSEHOLD
100.0/ 100
METRIC RATING
44th/ 347
METRIC RANK
4.9%
4 OR MORE VEHICLES IN HOUSEHOLD
0.0/ 100
METRIC RATING
311th/ 347
METRIC RANK
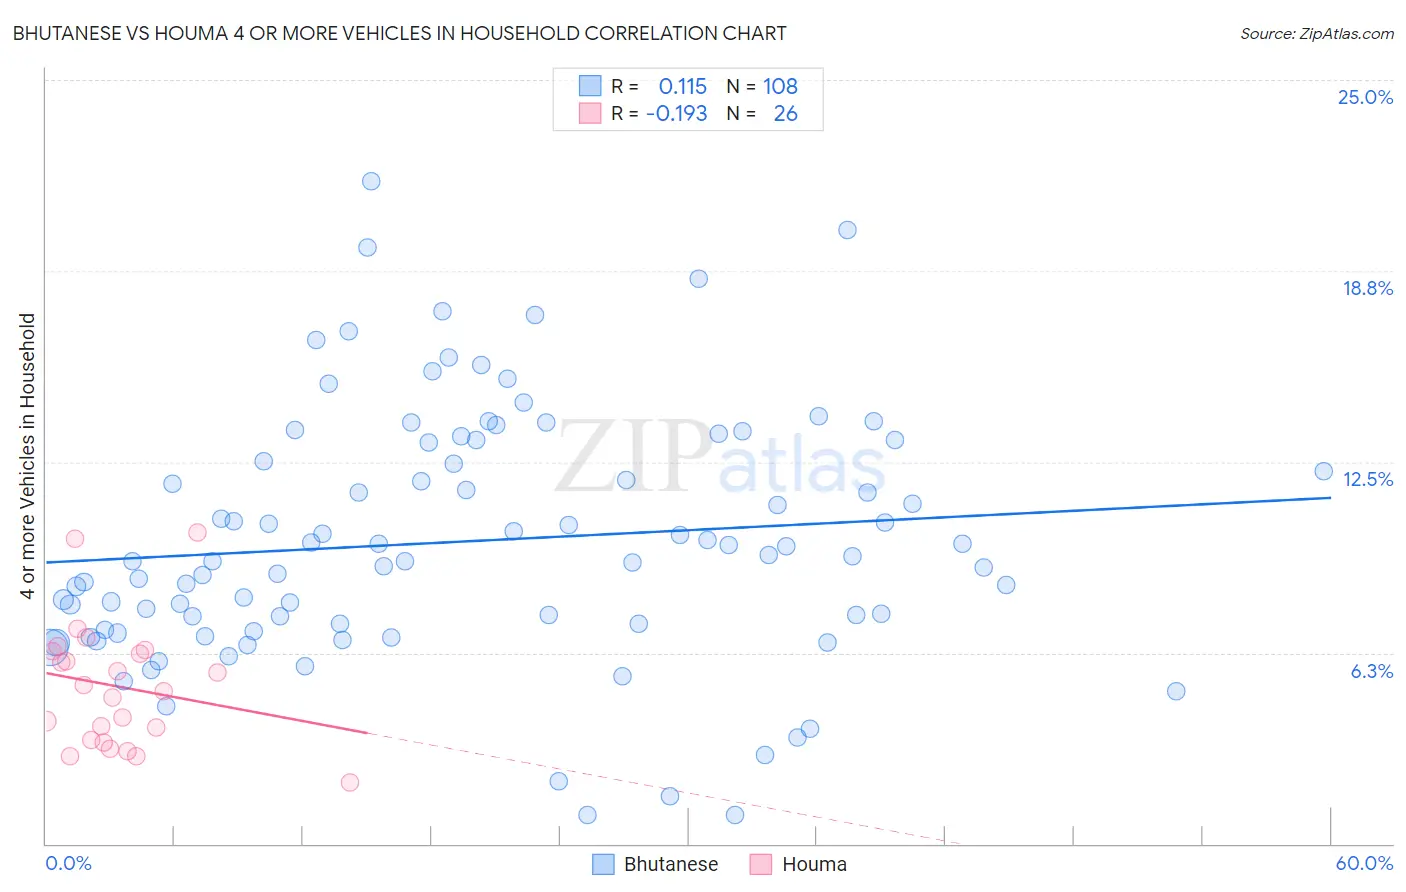
Bhutanese vs Houma 4 or more Vehicles in Household Correlation Chart
The statistical analysis conducted on geographies consisting of 453,167,793 people shows a poor positive correlation between the proportion of Bhutanese and percentage of households with 4 or more vehicles available in the United States with a correlation coefficient (R) of 0.115 and weighted average of 7.8%. Similarly, the statistical analysis conducted on geographies consisting of 36,738,728 people shows a poor negative correlation between the proportion of Houma and percentage of households with 4 or more vehicles available in the United States with a correlation coefficient (R) of -0.193 and weighted average of 4.9%, a difference of 58.8%.
4 or more Vehicles in Household Correlation Summary
| Measurement | Bhutanese | Houma |
| Minimum | 0.93% | 2.0% |
| Maximum | 21.7% | 10.2% |
| Range | 20.7% | 8.2% |
| Mean | 9.9% | 5.1% |
| Median | 9.3% | 5.1% |
| Interquartile 25% (IQ1) | 7.1% | 3.4% |
| Interquartile 75% (IQ3) | 12.8% | 6.3% |
| Interquartile Range (IQR) | 5.7% | 2.9% |
| Standard Deviation (Sample) | 4.1% | 2.0% |
| Standard Deviation (Population) | 4.1% | 2.0% |
Similar Demographics by 4 or more Vehicles in Household
Demographics Similar to Bhutanese by 4 or more Vehicles in Household
In terms of 4 or more vehicles in household, the demographic groups most similar to Bhutanese are Choctaw (7.8%, a difference of 0.050%), Crow (7.8%, a difference of 0.22%), Fijian (7.8%, a difference of 0.26%), Salvadoran (7.8%, a difference of 0.38%), and Osage (7.8%, a difference of 0.38%).
| Demographics | Rating | Rank | 4 or more Vehicles in Household |
| Scandinavians | 100.0 /100 | #37 | Exceptional 8.0% |
| Sioux | 100.0 /100 | #38 | Exceptional 8.0% |
| Spanish Americans | 100.0 /100 | #39 | Exceptional 8.0% |
| Spanish | 100.0 /100 | #40 | Exceptional 7.9% |
| Pima | 100.0 /100 | #41 | Exceptional 7.9% |
| Salvadorans | 100.0 /100 | #42 | Exceptional 7.8% |
| Fijians | 100.0 /100 | #43 | Exceptional 7.8% |
| Bhutanese | 100.0 /100 | #44 | Exceptional 7.8% |
| Choctaw | 100.0 /100 | #45 | Exceptional 7.8% |
| Crow | 100.0 /100 | #46 | Exceptional 7.8% |
| Osage | 100.0 /100 | #47 | Exceptional 7.8% |
| Swiss | 100.0 /100 | #48 | Exceptional 7.8% |
| Cherokee | 100.0 /100 | #49 | Exceptional 7.7% |
| Immigrants | El Salvador | 100.0 /100 | #50 | Exceptional 7.7% |
| Immigrants | Laos | 100.0 /100 | #51 | Exceptional 7.7% |
Demographics Similar to Houma by 4 or more Vehicles in Household
In terms of 4 or more vehicles in household, the demographic groups most similar to Houma are Moroccan (4.9%, a difference of 0.010%), Immigrants from Somalia (4.9%, a difference of 0.39%), Paraguayan (4.9%, a difference of 0.54%), Menominee (5.0%, a difference of 1.3%), and Immigrants from Serbia (5.0%, a difference of 2.2%).
| Demographics | Rating | Rank | 4 or more Vehicles in Household |
| Cypriots | 0.0 /100 | #304 | Tragic 5.0% |
| Somalis | 0.0 /100 | #305 | Tragic 5.0% |
| Immigrants | Serbia | 0.0 /100 | #306 | Tragic 5.0% |
| Menominee | 0.0 /100 | #307 | Tragic 5.0% |
| Paraguayans | 0.0 /100 | #308 | Tragic 4.9% |
| Immigrants | Somalia | 0.0 /100 | #309 | Tragic 4.9% |
| Moroccans | 0.0 /100 | #310 | Tragic 4.9% |
| Houma | 0.0 /100 | #311 | Tragic 4.9% |
| Albanians | 0.0 /100 | #312 | Tragic 4.8% |
| Immigrants | Israel | 0.0 /100 | #313 | Tragic 4.8% |
| Immigrants | West Indies | 0.0 /100 | #314 | Tragic 4.7% |
| Immigrants | Belarus | 0.0 /100 | #315 | Tragic 4.7% |
| Puerto Ricans | 0.0 /100 | #316 | Tragic 4.7% |
| U.S. Virgin Islanders | 0.0 /100 | #317 | Tragic 4.6% |
| Jamaicans | 0.0 /100 | #318 | Tragic 4.6% |