Belizean vs Immigrants from Sierra Leone In Labor Force | Age 16-19
COMPARE
Belizean
Immigrants from Sierra Leone
In Labor Force | Age 16-19
In Labor Force | Age 16-19 Comparison
Belizeans
Immigrants from Sierra Leone
32.8%
IN LABOR FORCE | AGE 16-19
0.0/ 100
METRIC RATING
302nd/ 347
METRIC RANK
37.3%
IN LABOR FORCE | AGE 16-19
83.6/ 100
METRIC RATING
152nd/ 347
METRIC RANK
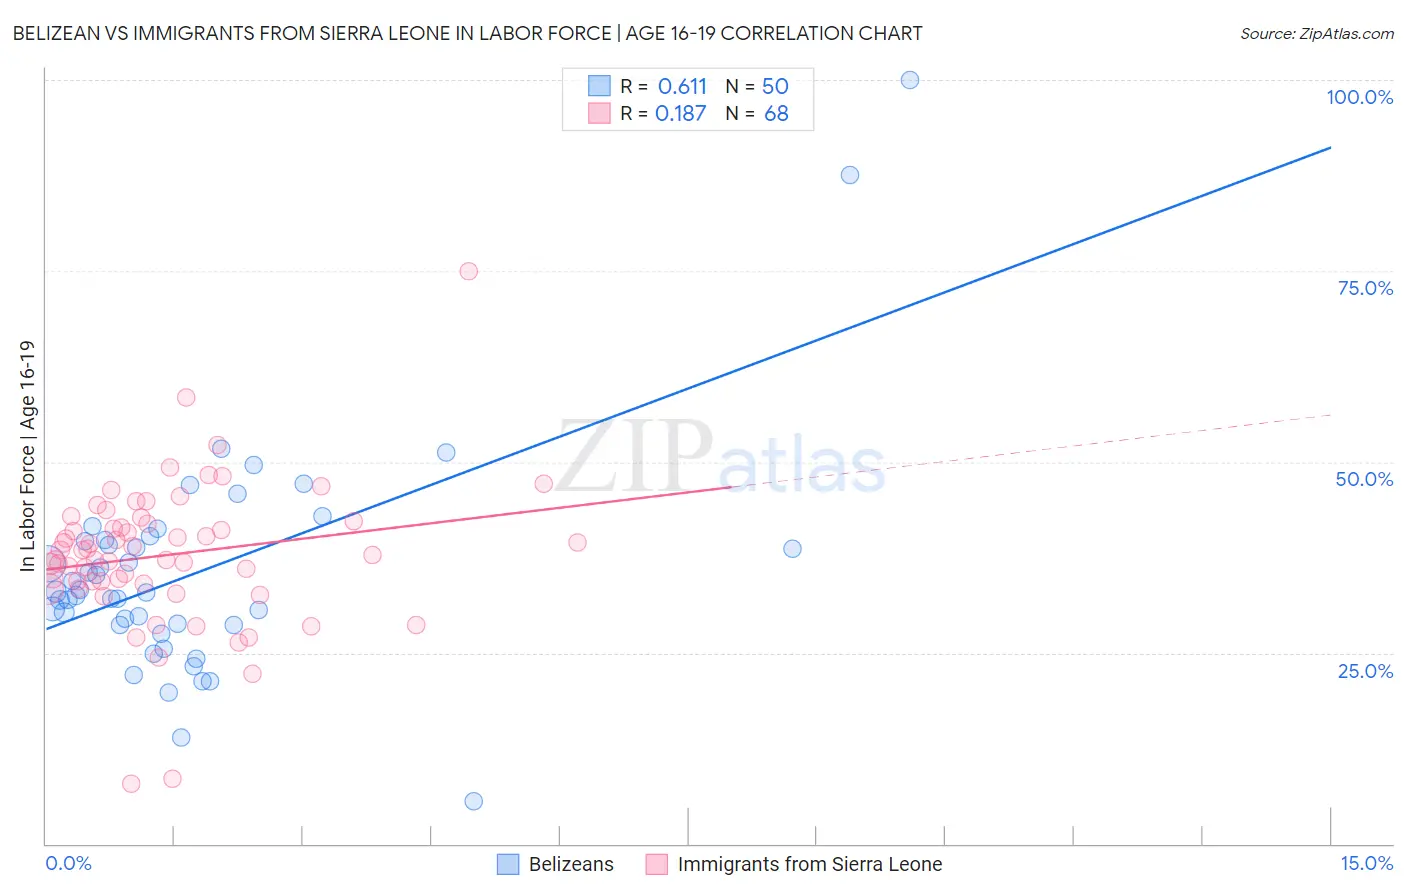
Belizean vs Immigrants from Sierra Leone In Labor Force | Age 16-19 Correlation Chart
The statistical analysis conducted on geographies consisting of 144,124,652 people shows a significant positive correlation between the proportion of Belizeans and labor force participation rate among population between the ages 16 and 19 in the United States with a correlation coefficient (R) of 0.611 and weighted average of 32.8%. Similarly, the statistical analysis conducted on geographies consisting of 101,607,840 people shows a poor positive correlation between the proportion of Immigrants from Sierra Leone and labor force participation rate among population between the ages 16 and 19 in the United States with a correlation coefficient (R) of 0.187 and weighted average of 37.3%, a difference of 13.9%.
In Labor Force | Age 16-19 Correlation Summary
| Measurement | Belizean | Immigrants from Sierra Leone |
| Minimum | 5.5% | 7.9% |
| Maximum | 100.0% | 75.0% |
| Range | 94.5% | 67.1% |
| Mean | 35.7% | 37.8% |
| Median | 32.9% | 38.1% |
| Interquartile 25% (IQ1) | 28.7% | 34.2% |
| Interquartile 75% (IQ3) | 39.8% | 42.1% |
| Interquartile Range (IQR) | 11.2% | 7.9% |
| Standard Deviation (Sample) | 15.2% | 9.5% |
| Standard Deviation (Population) | 15.0% | 9.5% |
Similar Demographics by In Labor Force | Age 16-19
Demographics Similar to Belizeans by In Labor Force | Age 16-19
In terms of in labor force | age 16-19, the demographic groups most similar to Belizeans are Okinawan (32.8%, a difference of 0.14%), Immigrants from Argentina (32.9%, a difference of 0.38%), Armenian (32.9%, a difference of 0.53%), Iranian (33.0%, a difference of 0.78%), and Immigrants from Dominica (32.5%, a difference of 0.90%).
| Demographics | Rating | Rank | In Labor Force | Age 16-19 |
| Yup'ik | 0.1 /100 | #295 | Tragic 33.3% |
| Jamaicans | 0.1 /100 | #296 | Tragic 33.2% |
| Immigrants | Haiti | 0.1 /100 | #297 | Tragic 33.2% |
| Iranians | 0.0 /100 | #298 | Tragic 33.0% |
| Armenians | 0.0 /100 | #299 | Tragic 32.9% |
| Immigrants | Argentina | 0.0 /100 | #300 | Tragic 32.9% |
| Okinawans | 0.0 /100 | #301 | Tragic 32.8% |
| Belizeans | 0.0 /100 | #302 | Tragic 32.8% |
| Immigrants | Dominica | 0.0 /100 | #303 | Tragic 32.5% |
| Israelis | 0.0 /100 | #304 | Tragic 32.4% |
| Nicaraguans | 0.0 /100 | #305 | Tragic 32.4% |
| Spanish American Indians | 0.0 /100 | #306 | Tragic 32.4% |
| Immigrants | Jamaica | 0.0 /100 | #307 | Tragic 32.2% |
| Navajo | 0.0 /100 | #308 | Tragic 32.1% |
| Immigrants | Eastern Asia | 0.0 /100 | #309 | Tragic 32.0% |
Demographics Similar to Immigrants from Sierra Leone by In Labor Force | Age 16-19
In terms of in labor force | age 16-19, the demographic groups most similar to Immigrants from Sierra Leone are Immigrants from Poland (37.3%, a difference of 0.070%), Tsimshian (37.4%, a difference of 0.10%), Native Hawaiian (37.4%, a difference of 0.13%), Arapaho (37.3%, a difference of 0.15%), and Immigrants from Bulgaria (37.3%, a difference of 0.17%).
| Demographics | Rating | Rank | In Labor Force | Age 16-19 |
| Paiute | 89.3 /100 | #145 | Excellent 37.5% |
| Immigrants | Western Europe | 88.9 /100 | #146 | Excellent 37.5% |
| Brazilians | 88.7 /100 | #147 | Excellent 37.5% |
| Romanians | 87.3 /100 | #148 | Excellent 37.5% |
| Native Hawaiians | 85.0 /100 | #149 | Excellent 37.4% |
| Tsimshian | 84.7 /100 | #150 | Excellent 37.4% |
| Immigrants | Poland | 84.4 /100 | #151 | Excellent 37.3% |
| Immigrants | Sierra Leone | 83.6 /100 | #152 | Excellent 37.3% |
| Arapaho | 81.8 /100 | #153 | Excellent 37.3% |
| Immigrants | Bulgaria | 81.6 /100 | #154 | Excellent 37.3% |
| Immigrants | Lithuania | 80.7 /100 | #155 | Excellent 37.2% |
| Kiowa | 80.4 /100 | #156 | Excellent 37.2% |
| Immigrants | Brazil | 76.5 /100 | #157 | Good 37.1% |
| Ute | 75.7 /100 | #158 | Good 37.1% |
| Yaqui | 74.4 /100 | #159 | Good 37.1% |