Belizean vs Immigrants from South Central Asia In Labor Force | Age 16-19
COMPARE
Belizean
Immigrants from South Central Asia
In Labor Force | Age 16-19
In Labor Force | Age 16-19 Comparison
Belizeans
Immigrants from South Central Asia
32.8%
IN LABOR FORCE | AGE 16-19
0.0/ 100
METRIC RATING
302nd/ 347
METRIC RANK
34.6%
IN LABOR FORCE | AGE 16-19
1.3/ 100
METRIC RATING
256th/ 347
METRIC RANK
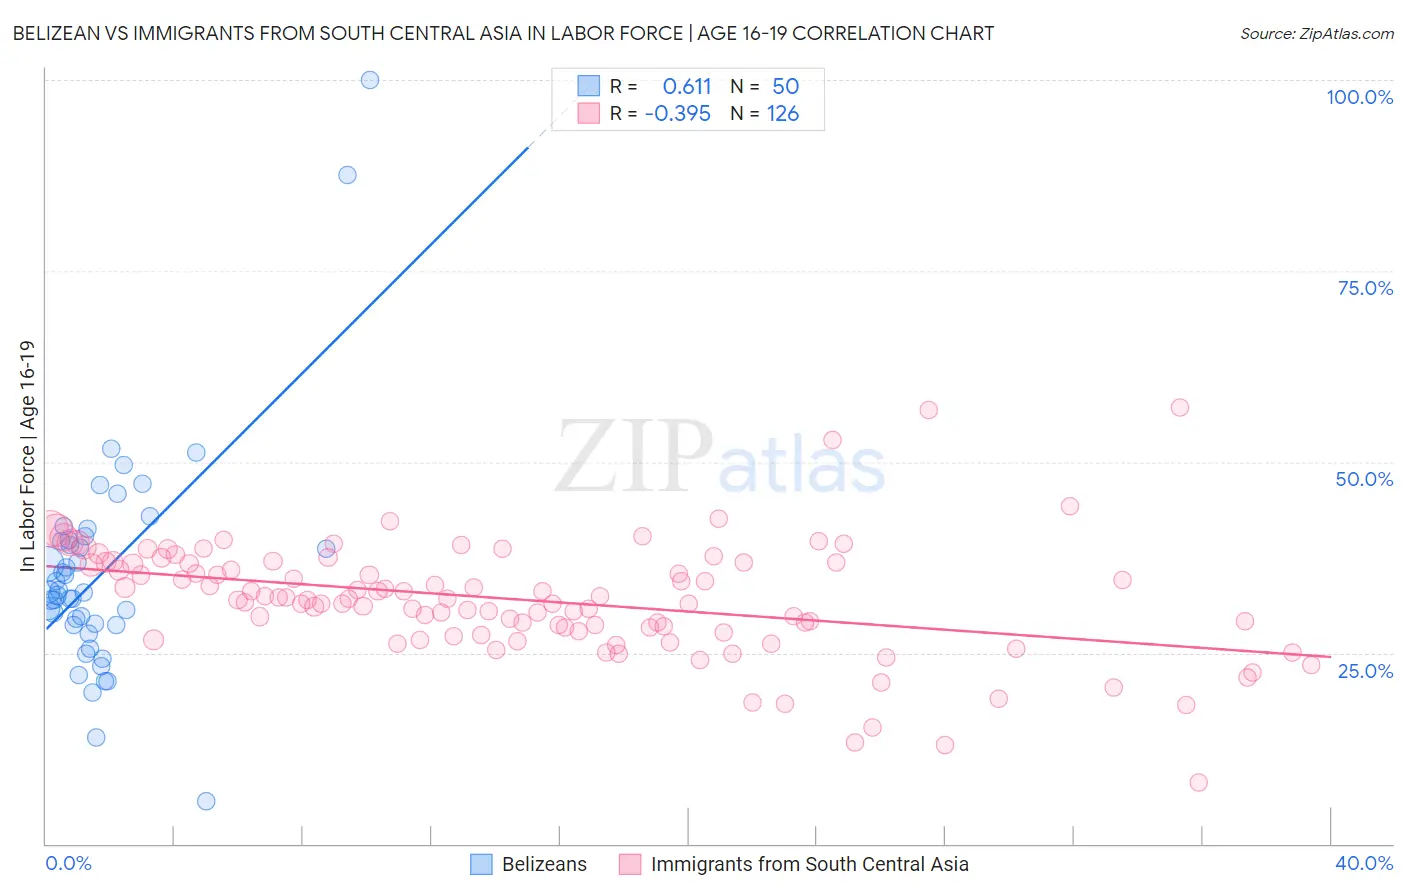
Belizean vs Immigrants from South Central Asia In Labor Force | Age 16-19 Correlation Chart
The statistical analysis conducted on geographies consisting of 144,124,652 people shows a significant positive correlation between the proportion of Belizeans and labor force participation rate among population between the ages 16 and 19 in the United States with a correlation coefficient (R) of 0.611 and weighted average of 32.8%. Similarly, the statistical analysis conducted on geographies consisting of 472,115,332 people shows a mild negative correlation between the proportion of Immigrants from South Central Asia and labor force participation rate among population between the ages 16 and 19 in the United States with a correlation coefficient (R) of -0.395 and weighted average of 34.6%, a difference of 5.5%.
In Labor Force | Age 16-19 Correlation Summary
| Measurement | Belizean | Immigrants from South Central Asia |
| Minimum | 5.5% | 8.1% |
| Maximum | 100.0% | 57.1% |
| Range | 94.5% | 49.0% |
| Mean | 35.7% | 31.9% |
| Median | 32.9% | 32.0% |
| Interquartile 25% (IQ1) | 28.7% | 27.9% |
| Interquartile 75% (IQ3) | 39.8% | 36.8% |
| Interquartile Range (IQR) | 11.2% | 8.9% |
| Standard Deviation (Sample) | 15.2% | 7.5% |
| Standard Deviation (Population) | 15.0% | 7.5% |
Similar Demographics by In Labor Force | Age 16-19
Demographics Similar to Belizeans by In Labor Force | Age 16-19
In terms of in labor force | age 16-19, the demographic groups most similar to Belizeans are Okinawan (32.8%, a difference of 0.14%), Immigrants from Argentina (32.9%, a difference of 0.38%), Armenian (32.9%, a difference of 0.53%), Iranian (33.0%, a difference of 0.78%), and Immigrants from Dominica (32.5%, a difference of 0.90%).
| Demographics | Rating | Rank | In Labor Force | Age 16-19 |
| Yup'ik | 0.1 /100 | #295 | Tragic 33.3% |
| Jamaicans | 0.1 /100 | #296 | Tragic 33.2% |
| Immigrants | Haiti | 0.1 /100 | #297 | Tragic 33.2% |
| Iranians | 0.0 /100 | #298 | Tragic 33.0% |
| Armenians | 0.0 /100 | #299 | Tragic 32.9% |
| Immigrants | Argentina | 0.0 /100 | #300 | Tragic 32.9% |
| Okinawans | 0.0 /100 | #301 | Tragic 32.8% |
| Belizeans | 0.0 /100 | #302 | Tragic 32.8% |
| Immigrants | Dominica | 0.0 /100 | #303 | Tragic 32.5% |
| Israelis | 0.0 /100 | #304 | Tragic 32.4% |
| Nicaraguans | 0.0 /100 | #305 | Tragic 32.4% |
| Spanish American Indians | 0.0 /100 | #306 | Tragic 32.4% |
| Immigrants | Jamaica | 0.0 /100 | #307 | Tragic 32.2% |
| Navajo | 0.0 /100 | #308 | Tragic 32.1% |
| Immigrants | Eastern Asia | 0.0 /100 | #309 | Tragic 32.0% |
Demographics Similar to Immigrants from South Central Asia by In Labor Force | Age 16-19
In terms of in labor force | age 16-19, the demographic groups most similar to Immigrants from South Central Asia are Immigrants from Egypt (34.6%, a difference of 0.010%), Thai (34.6%, a difference of 0.010%), Immigrants (34.6%, a difference of 0.030%), Peruvian (34.6%, a difference of 0.11%), and Egyptian (34.5%, a difference of 0.11%).
| Demographics | Rating | Rank | In Labor Force | Age 16-19 |
| Immigrants | Ukraine | 2.2 /100 | #249 | Tragic 34.8% |
| Immigrants | Pakistan | 2.0 /100 | #250 | Tragic 34.8% |
| Immigrants | Western Asia | 2.0 /100 | #251 | Tragic 34.8% |
| Immigrants | Chile | 2.0 /100 | #252 | Tragic 34.8% |
| Immigrants | Japan | 1.5 /100 | #253 | Tragic 34.7% |
| Bahamians | 1.4 /100 | #254 | Tragic 34.6% |
| Peruvians | 1.4 /100 | #255 | Tragic 34.6% |
| Immigrants | South Central Asia | 1.3 /100 | #256 | Tragic 34.6% |
| Immigrants | Egypt | 1.2 /100 | #257 | Tragic 34.6% |
| Thais | 1.2 /100 | #258 | Tragic 34.6% |
| Immigrants | Immigrants | 1.2 /100 | #259 | Tragic 34.6% |
| Egyptians | 1.2 /100 | #260 | Tragic 34.5% |
| Salvadorans | 1.1 /100 | #261 | Tragic 34.5% |
| Hispanics or Latinos | 1.1 /100 | #262 | Tragic 34.5% |
| Burmese | 1.1 /100 | #263 | Tragic 34.5% |