Belizean vs Immigrants from Sierra Leone Unemployment Among Women with Children Ages 6 to 17 years
COMPARE
Belizean
Immigrants from Sierra Leone
Unemployment Among Women with Children Ages 6 to 17 years
Unemployment Among Women with Children Ages 6 to 17 years Comparison
Belizeans
Immigrants from Sierra Leone
9.1%
UNEMPLOYMENT AMONG WOMEN WITH CHILDREN AGES 6 TO 17 YEARS
28.4/ 100
METRIC RATING
191st/ 347
METRIC RANK
9.0%
UNEMPLOYMENT AMONG WOMEN WITH CHILDREN AGES 6 TO 17 YEARS
45.9/ 100
METRIC RATING
175th/ 347
METRIC RANK
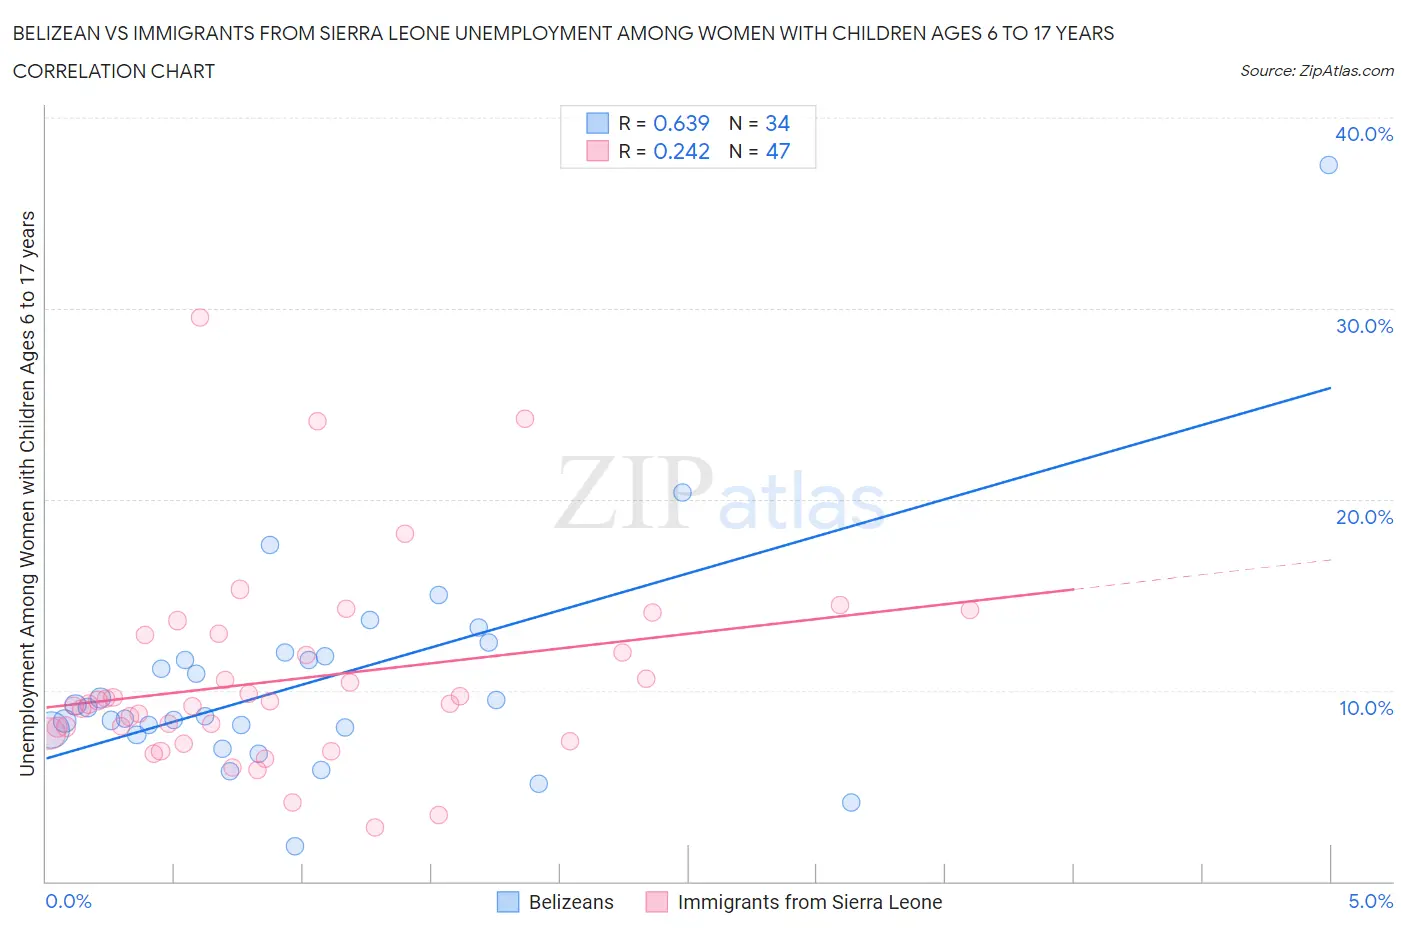
Belizean vs Immigrants from Sierra Leone Unemployment Among Women with Children Ages 6 to 17 years Correlation Chart
The statistical analysis conducted on geographies consisting of 125,536,739 people shows a significant positive correlation between the proportion of Belizeans and unemployment rate among women with children between the ages 6 and 17 in the United States with a correlation coefficient (R) of 0.639 and weighted average of 9.1%. Similarly, the statistical analysis conducted on geographies consisting of 90,469,077 people shows a weak positive correlation between the proportion of Immigrants from Sierra Leone and unemployment rate among women with children between the ages 6 and 17 in the United States with a correlation coefficient (R) of 0.242 and weighted average of 9.0%, a difference of 0.84%.
Unemployment Among Women with Children Ages 6 to 17 years Correlation Summary
| Measurement | Belizean | Immigrants from Sierra Leone |
| Minimum | 1.8% | 2.8% |
| Maximum | 37.5% | 29.5% |
| Range | 35.7% | 26.7% |
| Mean | 10.4% | 10.6% |
| Median | 8.9% | 9.3% |
| Interquartile 25% (IQ1) | 8.0% | 7.7% |
| Interquartile 75% (IQ3) | 11.8% | 12.9% |
| Interquartile Range (IQR) | 3.8% | 5.2% |
| Standard Deviation (Sample) | 6.0% | 5.2% |
| Standard Deviation (Population) | 5.9% | 5.1% |
Demographics Similar to Belizeans and Immigrants from Sierra Leone by Unemployment Among Women with Children Ages 6 to 17 years
In terms of unemployment among women with children ages 6 to 17 years, the demographic groups most similar to Belizeans are Slovene (9.1%, a difference of 0.0%), Immigrants (9.1%, a difference of 0.040%), Immigrants from Syria (9.1%, a difference of 0.070%), Guamanian/Chamorro (9.1%, a difference of 0.070%), and Comanche (9.0%, a difference of 0.080%). Similarly, the demographic groups most similar to Immigrants from Sierra Leone are Immigrants from Italy (9.0%, a difference of 0.10%), Immigrants from Costa Rica (9.0%, a difference of 0.18%), Immigrants from Jordan (9.0%, a difference of 0.20%), Immigrants from Brazil (9.0%, a difference of 0.23%), and Menominee (9.0%, a difference of 0.30%).
| Demographics | Rating | Rank | Unemployment Among Women with Children Ages 6 to 17 years |
| Immigrants | Brazil | 51.0 /100 | #173 | Average 9.0% |
| Immigrants | Costa Rica | 50.0 /100 | #174 | Average 9.0% |
| Immigrants | Sierra Leone | 45.9 /100 | #175 | Average 9.0% |
| Immigrants | Italy | 43.7 /100 | #176 | Average 9.0% |
| Immigrants | Jordan | 41.6 /100 | #177 | Average 9.0% |
| Menominee | 39.3 /100 | #178 | Fair 9.0% |
| Immigrants | Zaire | 38.3 /100 | #179 | Fair 9.0% |
| Ethiopians | 37.6 /100 | #180 | Fair 9.0% |
| Immigrants | Czechoslovakia | 34.5 /100 | #181 | Fair 9.0% |
| South American Indians | 34.4 /100 | #182 | Fair 9.0% |
| Swiss | 33.5 /100 | #183 | Fair 9.0% |
| Palestinians | 33.4 /100 | #184 | Fair 9.0% |
| Immigrants | Congo | 32.5 /100 | #185 | Fair 9.0% |
| Immigrants | Spain | 32.4 /100 | #186 | Fair 9.0% |
| Comanche | 30.0 /100 | #187 | Fair 9.0% |
| Immigrants | Syria | 29.7 /100 | #188 | Fair 9.1% |
| Immigrants | Immigrants | 29.2 /100 | #189 | Fair 9.1% |
| Slovenes | 28.5 /100 | #190 | Fair 9.1% |
| Belizeans | 28.4 /100 | #191 | Fair 9.1% |
| Guamanians/Chamorros | 27.2 /100 | #192 | Fair 9.1% |
| Immigrants | Turkey | 25.8 /100 | #193 | Fair 9.1% |