Belizean vs Immigrants from Sierra Leone Family Households with Children
COMPARE
Belizean
Immigrants from Sierra Leone
Family Households with Children
Family Households with Children Comparison
Belizeans
Immigrants from Sierra Leone
27.8%
FAMILY HOUSEHOLDS WITH CHILDREN
90.0/ 100
METRIC RATING
127th/ 347
METRIC RANK
29.3%
FAMILY HOUSEHOLDS WITH CHILDREN
100.0/ 100
METRIC RATING
35th/ 347
METRIC RANK
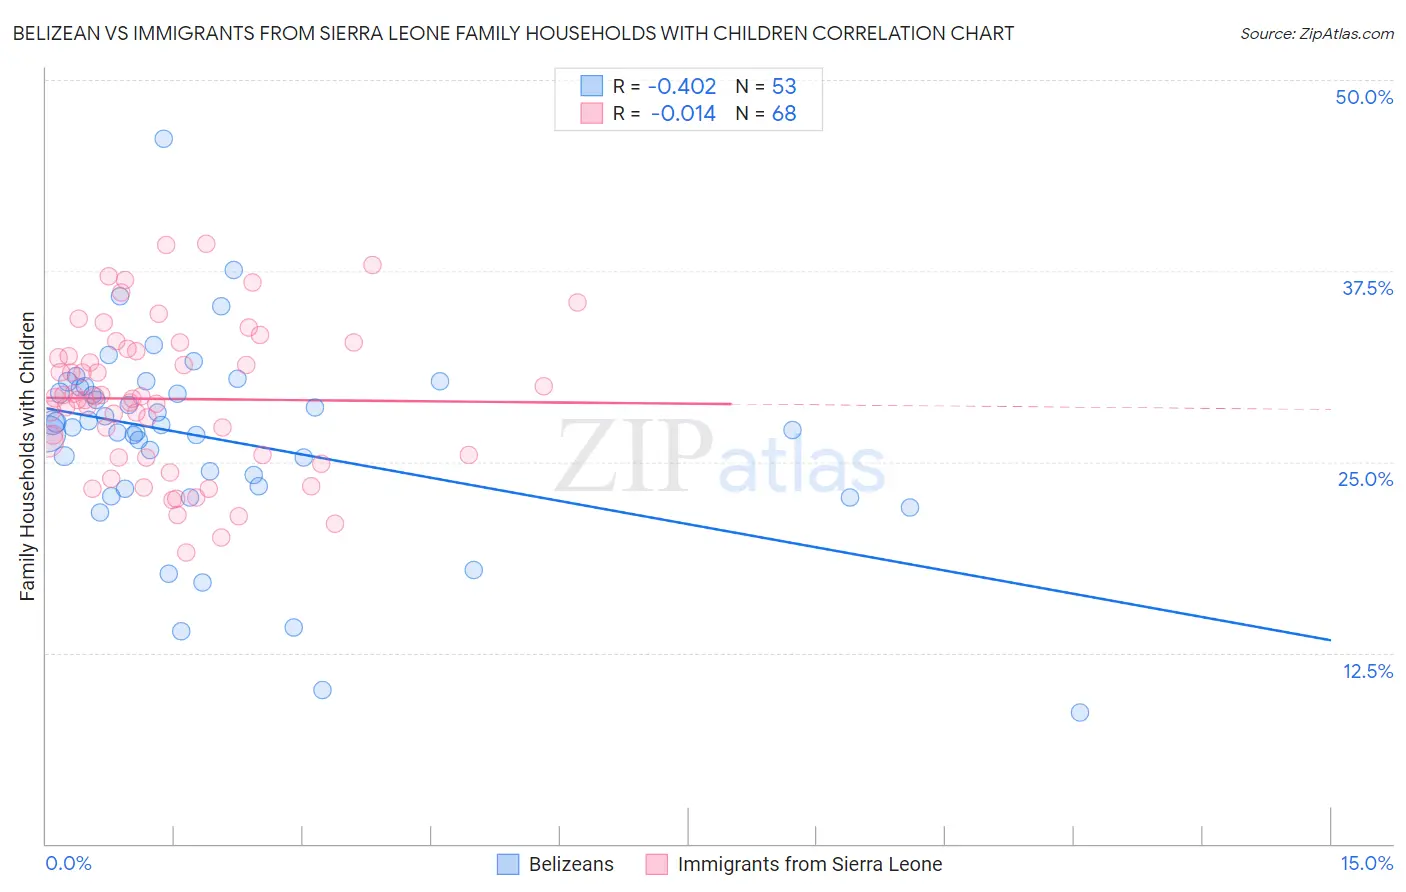
Belizean vs Immigrants from Sierra Leone Family Households with Children Correlation Chart
The statistical analysis conducted on geographies consisting of 144,146,110 people shows a moderate negative correlation between the proportion of Belizeans and percentage of family households with children in the United States with a correlation coefficient (R) of -0.402 and weighted average of 27.8%. Similarly, the statistical analysis conducted on geographies consisting of 101,637,197 people shows no correlation between the proportion of Immigrants from Sierra Leone and percentage of family households with children in the United States with a correlation coefficient (R) of -0.014 and weighted average of 29.3%, a difference of 5.5%.
Family Households with Children Correlation Summary
| Measurement | Belizean | Immigrants from Sierra Leone |
| Minimum | 8.6% | 19.1% |
| Maximum | 46.2% | 39.3% |
| Range | 37.6% | 20.2% |
| Mean | 26.4% | 29.1% |
| Median | 27.3% | 29.2% |
| Interquartile 25% (IQ1) | 23.3% | 25.4% |
| Interquartile 75% (IQ3) | 29.9% | 32.3% |
| Interquartile Range (IQR) | 6.6% | 6.9% |
| Standard Deviation (Sample) | 6.5% | 4.8% |
| Standard Deviation (Population) | 6.4% | 4.8% |
Similar Demographics by Family Households with Children
Demographics Similar to Belizeans by Family Households with Children
In terms of family households with children, the demographic groups most similar to Belizeans are Syrian (27.8%, a difference of 0.020%), Immigrants from Ethiopia (27.8%, a difference of 0.030%), Immigrants from Eritrea (27.8%, a difference of 0.040%), Immigrants from Singapore (27.8%, a difference of 0.050%), and Ecuadorian (27.8%, a difference of 0.050%).
| Demographics | Rating | Rank | Family Households with Children |
| Europeans | 95.4 /100 | #120 | Exceptional 27.9% |
| Immigrants | Western Asia | 93.6 /100 | #121 | Exceptional 27.9% |
| Immigrants | Zimbabwe | 92.8 /100 | #122 | Exceptional 27.8% |
| Immigrants | Northern Africa | 91.8 /100 | #123 | Exceptional 27.8% |
| Immigrants | Singapore | 90.8 /100 | #124 | Exceptional 27.8% |
| Ecuadorians | 90.8 /100 | #125 | Exceptional 27.8% |
| Immigrants | Ethiopia | 90.5 /100 | #126 | Exceptional 27.8% |
| Belizeans | 90.0 /100 | #127 | Exceptional 27.8% |
| Syrians | 89.7 /100 | #128 | Excellent 27.8% |
| Immigrants | Eritrea | 89.4 /100 | #129 | Excellent 27.8% |
| Cajuns | 87.6 /100 | #130 | Excellent 27.7% |
| Lebanese | 87.4 /100 | #131 | Excellent 27.7% |
| Immigrants | Belize | 85.7 /100 | #132 | Excellent 27.7% |
| Iranians | 85.2 /100 | #133 | Excellent 27.7% |
| Immigrants | Panama | 84.9 /100 | #134 | Excellent 27.7% |
Demographics Similar to Immigrants from Sierra Leone by Family Households with Children
In terms of family households with children, the demographic groups most similar to Immigrants from Sierra Leone are Immigrants from Venezuela (29.3%, a difference of 0.010%), Immigrants from Bolivia (29.3%, a difference of 0.16%), Venezuelan (29.4%, a difference of 0.22%), Immigrants from Cameroon (29.2%, a difference of 0.28%), and Immigrants from Yemen (29.4%, a difference of 0.41%).
| Demographics | Rating | Rank | Family Households with Children |
| Samoans | 100.0 /100 | #28 | Exceptional 29.5% |
| Bolivians | 100.0 /100 | #29 | Exceptional 29.5% |
| Yuman | 100.0 /100 | #30 | Exceptional 29.5% |
| Japanese | 100.0 /100 | #31 | Exceptional 29.4% |
| Immigrants | Yemen | 100.0 /100 | #32 | Exceptional 29.4% |
| Venezuelans | 100.0 /100 | #33 | Exceptional 29.4% |
| Immigrants | Bolivia | 100.0 /100 | #34 | Exceptional 29.3% |
| Immigrants | Sierra Leone | 100.0 /100 | #35 | Exceptional 29.3% |
| Immigrants | Venezuela | 100.0 /100 | #36 | Exceptional 29.3% |
| Immigrants | Cameroon | 100.0 /100 | #37 | Exceptional 29.2% |
| Koreans | 100.0 /100 | #38 | Exceptional 29.2% |
| Yaqui | 100.0 /100 | #39 | Exceptional 29.1% |
| Central Americans | 100.0 /100 | #40 | Exceptional 29.1% |
| Immigrants | South Eastern Asia | 100.0 /100 | #41 | Exceptional 29.1% |
| Spanish American Indians | 100.0 /100 | #42 | Exceptional 29.1% |