Aleut vs Immigrants from Sierra Leone In Labor Force | Age 16-19
COMPARE
Aleut
Immigrants from Sierra Leone
In Labor Force | Age 16-19
In Labor Force | Age 16-19 Comparison
Aleuts
Immigrants from Sierra Leone
40.4%
IN LABOR FORCE | AGE 16-19
100.0/ 100
METRIC RATING
58th/ 347
METRIC RANK
37.3%
IN LABOR FORCE | AGE 16-19
83.6/ 100
METRIC RATING
152nd/ 347
METRIC RANK
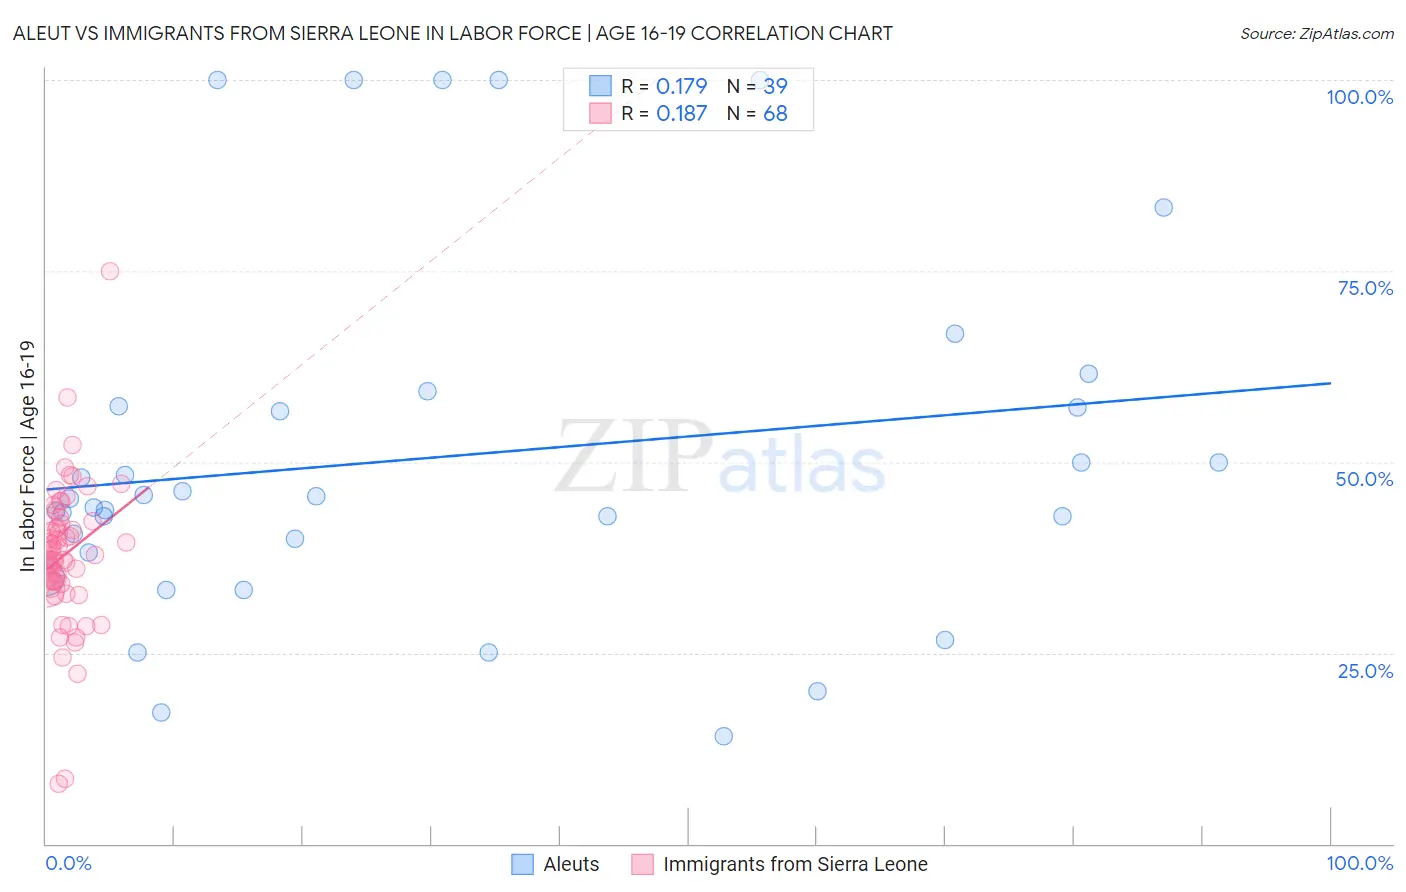
Aleut vs Immigrants from Sierra Leone In Labor Force | Age 16-19 Correlation Chart
The statistical analysis conducted on geographies consisting of 61,744,567 people shows a poor positive correlation between the proportion of Aleuts and labor force participation rate among population between the ages 16 and 19 in the United States with a correlation coefficient (R) of 0.179 and weighted average of 40.4%. Similarly, the statistical analysis conducted on geographies consisting of 101,607,840 people shows a poor positive correlation between the proportion of Immigrants from Sierra Leone and labor force participation rate among population between the ages 16 and 19 in the United States with a correlation coefficient (R) of 0.187 and weighted average of 37.3%, a difference of 8.3%.
In Labor Force | Age 16-19 Correlation Summary
| Measurement | Aleut | Immigrants from Sierra Leone |
| Minimum | 14.1% | 7.9% |
| Maximum | 100.0% | 75.0% |
| Range | 85.9% | 67.1% |
| Mean | 50.6% | 37.8% |
| Median | 45.1% | 38.1% |
| Interquartile 25% (IQ1) | 38.2% | 34.2% |
| Interquartile 75% (IQ3) | 57.3% | 42.1% |
| Interquartile Range (IQR) | 19.1% | 7.9% |
| Standard Deviation (Sample) | 23.4% | 9.5% |
| Standard Deviation (Population) | 23.1% | 9.5% |
Similar Demographics by In Labor Force | Age 16-19
Demographics Similar to Aleuts by In Labor Force | Age 16-19
In terms of in labor force | age 16-19, the demographic groups most similar to Aleuts are Lithuanian (40.4%, a difference of 0.010%), Fijian (40.4%, a difference of 0.040%), British (40.5%, a difference of 0.13%), Slavic (40.4%, a difference of 0.13%), and Tlingit-Haida (40.5%, a difference of 0.16%).
| Demographics | Rating | Rank | In Labor Force | Age 16-19 |
| Immigrants | Zaire | 100.0 /100 | #51 | Exceptional 40.7% |
| Immigrants | Laos | 100.0 /100 | #52 | Exceptional 40.6% |
| Immigrants | Kenya | 100.0 /100 | #53 | Exceptional 40.5% |
| Tlingit-Haida | 100.0 /100 | #54 | Exceptional 40.5% |
| British | 100.0 /100 | #55 | Exceptional 40.5% |
| Fijians | 100.0 /100 | #56 | Exceptional 40.4% |
| Lithuanians | 100.0 /100 | #57 | Exceptional 40.4% |
| Aleuts | 100.0 /100 | #58 | Exceptional 40.4% |
| Slavs | 100.0 /100 | #59 | Exceptional 40.4% |
| Immigrants | Eastern Africa | 100.0 /100 | #60 | Exceptional 40.4% |
| Americans | 100.0 /100 | #61 | Exceptional 40.3% |
| Cherokee | 100.0 /100 | #62 | Exceptional 40.2% |
| Northern Europeans | 100.0 /100 | #63 | Exceptional 40.2% |
| Immigrants | Micronesia | 100.0 /100 | #64 | Exceptional 40.2% |
| Kenyans | 100.0 /100 | #65 | Exceptional 40.1% |
Demographics Similar to Immigrants from Sierra Leone by In Labor Force | Age 16-19
In terms of in labor force | age 16-19, the demographic groups most similar to Immigrants from Sierra Leone are Immigrants from Poland (37.3%, a difference of 0.070%), Tsimshian (37.4%, a difference of 0.10%), Native Hawaiian (37.4%, a difference of 0.13%), Arapaho (37.3%, a difference of 0.15%), and Immigrants from Bulgaria (37.3%, a difference of 0.17%).
| Demographics | Rating | Rank | In Labor Force | Age 16-19 |
| Paiute | 89.3 /100 | #145 | Excellent 37.5% |
| Immigrants | Western Europe | 88.9 /100 | #146 | Excellent 37.5% |
| Brazilians | 88.7 /100 | #147 | Excellent 37.5% |
| Romanians | 87.3 /100 | #148 | Excellent 37.5% |
| Native Hawaiians | 85.0 /100 | #149 | Excellent 37.4% |
| Tsimshian | 84.7 /100 | #150 | Excellent 37.4% |
| Immigrants | Poland | 84.4 /100 | #151 | Excellent 37.3% |
| Immigrants | Sierra Leone | 83.6 /100 | #152 | Excellent 37.3% |
| Arapaho | 81.8 /100 | #153 | Excellent 37.3% |
| Immigrants | Bulgaria | 81.6 /100 | #154 | Excellent 37.3% |
| Immigrants | Lithuania | 80.7 /100 | #155 | Excellent 37.2% |
| Kiowa | 80.4 /100 | #156 | Excellent 37.2% |
| Immigrants | Brazil | 76.5 /100 | #157 | Good 37.1% |
| Ute | 75.7 /100 | #158 | Good 37.1% |
| Yaqui | 74.4 /100 | #159 | Good 37.1% |