Hispanic or Latino vs Immigrants from Sierra Leone In Labor Force | Age 16-19
COMPARE
Hispanic or Latino
Immigrants from Sierra Leone
In Labor Force | Age 16-19
In Labor Force | Age 16-19 Comparison
Hispanics or Latinos
Immigrants from Sierra Leone
34.5%
IN LABOR FORCE | AGE 16-19
1.1/ 100
METRIC RATING
262nd/ 347
METRIC RANK
37.3%
IN LABOR FORCE | AGE 16-19
83.6/ 100
METRIC RATING
152nd/ 347
METRIC RANK
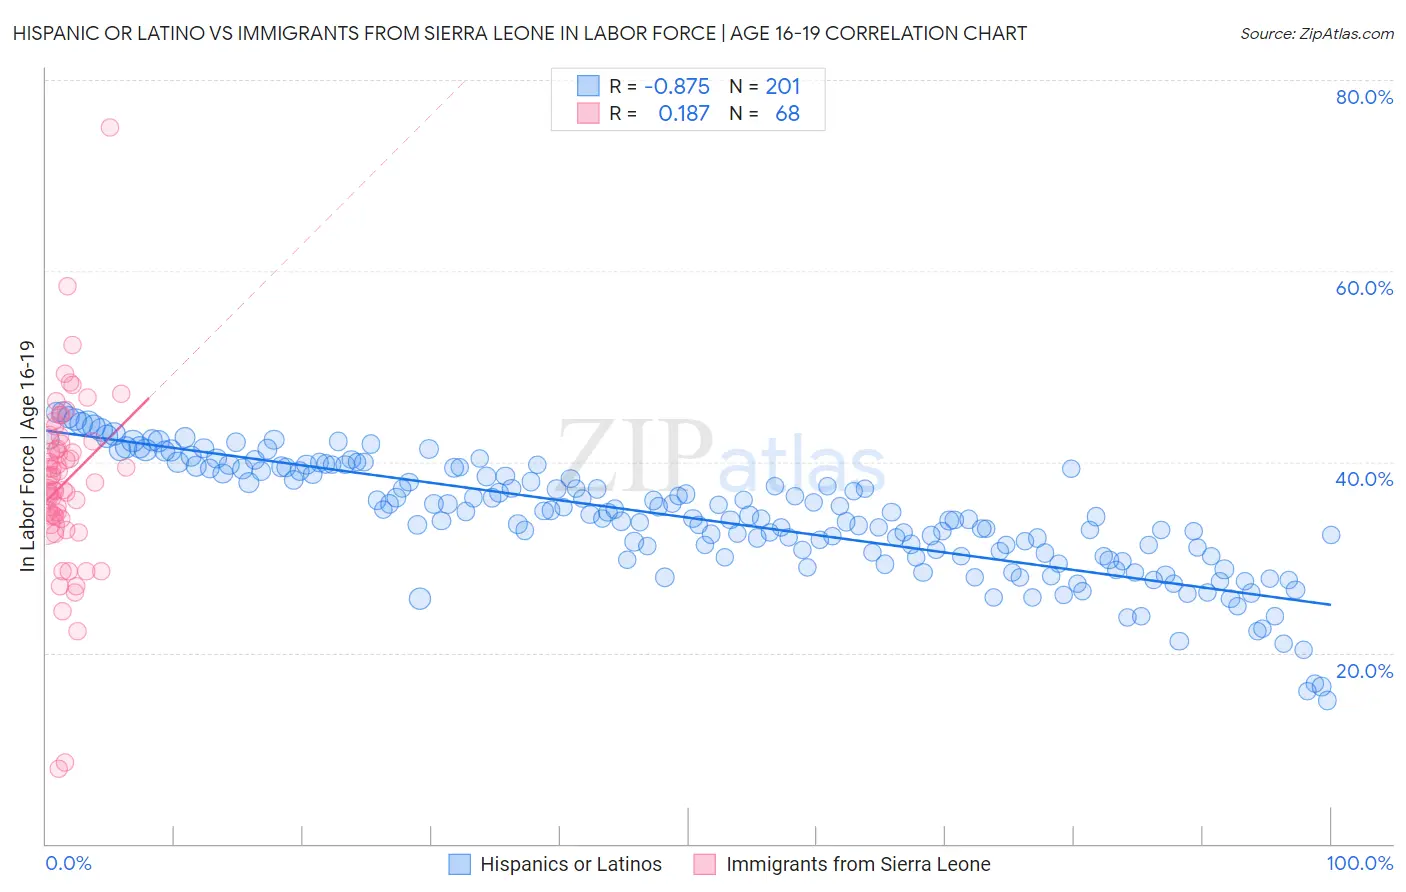
Hispanic or Latino vs Immigrants from Sierra Leone In Labor Force | Age 16-19 Correlation Chart
The statistical analysis conducted on geographies consisting of 573,733,594 people shows a very strong negative correlation between the proportion of Hispanics or Latinos and labor force participation rate among population between the ages 16 and 19 in the United States with a correlation coefficient (R) of -0.875 and weighted average of 34.5%. Similarly, the statistical analysis conducted on geographies consisting of 101,607,840 people shows a poor positive correlation between the proportion of Immigrants from Sierra Leone and labor force participation rate among population between the ages 16 and 19 in the United States with a correlation coefficient (R) of 0.187 and weighted average of 37.3%, a difference of 8.2%.
In Labor Force | Age 16-19 Correlation Summary
| Measurement | Hispanic or Latino | Immigrants from Sierra Leone |
| Minimum | 15.0% | 7.9% |
| Maximum | 45.2% | 75.0% |
| Range | 30.2% | 67.1% |
| Mean | 34.1% | 37.8% |
| Median | 34.3% | 38.1% |
| Interquartile 25% (IQ1) | 30.2% | 34.2% |
| Interquartile 75% (IQ3) | 39.3% | 42.1% |
| Interquartile Range (IQR) | 9.1% | 7.9% |
| Standard Deviation (Sample) | 6.1% | 9.5% |
| Standard Deviation (Population) | 6.1% | 9.5% |
Similar Demographics by In Labor Force | Age 16-19
Demographics Similar to Hispanics or Latinos by In Labor Force | Age 16-19
In terms of in labor force | age 16-19, the demographic groups most similar to Hispanics or Latinos are Salvadoran (34.5%, a difference of 0.010%), Burmese (34.5%, a difference of 0.040%), Egyptian (34.5%, a difference of 0.050%), Immigrants (34.6%, a difference of 0.13%), and Immigrants from Egypt (34.6%, a difference of 0.15%).
| Demographics | Rating | Rank | In Labor Force | Age 16-19 |
| Peruvians | 1.4 /100 | #255 | Tragic 34.6% |
| Immigrants | South Central Asia | 1.3 /100 | #256 | Tragic 34.6% |
| Immigrants | Egypt | 1.2 /100 | #257 | Tragic 34.6% |
| Thais | 1.2 /100 | #258 | Tragic 34.6% |
| Immigrants | Immigrants | 1.2 /100 | #259 | Tragic 34.6% |
| Egyptians | 1.2 /100 | #260 | Tragic 34.5% |
| Salvadorans | 1.1 /100 | #261 | Tragic 34.5% |
| Hispanics or Latinos | 1.1 /100 | #262 | Tragic 34.5% |
| Burmese | 1.1 /100 | #263 | Tragic 34.5% |
| Immigrants | Uruguay | 0.9 /100 | #264 | Tragic 34.4% |
| Immigrants | El Salvador | 0.7 /100 | #265 | Tragic 34.3% |
| Immigrants | Malaysia | 0.7 /100 | #266 | Tragic 34.3% |
| Immigrants | Peru | 0.5 /100 | #267 | Tragic 34.2% |
| Immigrants | Asia | 0.5 /100 | #268 | Tragic 34.1% |
| Pima | 0.5 /100 | #269 | Tragic 34.1% |
Demographics Similar to Immigrants from Sierra Leone by In Labor Force | Age 16-19
In terms of in labor force | age 16-19, the demographic groups most similar to Immigrants from Sierra Leone are Immigrants from Poland (37.3%, a difference of 0.070%), Tsimshian (37.4%, a difference of 0.10%), Native Hawaiian (37.4%, a difference of 0.13%), Arapaho (37.3%, a difference of 0.15%), and Immigrants from Bulgaria (37.3%, a difference of 0.17%).
| Demographics | Rating | Rank | In Labor Force | Age 16-19 |
| Paiute | 89.3 /100 | #145 | Excellent 37.5% |
| Immigrants | Western Europe | 88.9 /100 | #146 | Excellent 37.5% |
| Brazilians | 88.7 /100 | #147 | Excellent 37.5% |
| Romanians | 87.3 /100 | #148 | Excellent 37.5% |
| Native Hawaiians | 85.0 /100 | #149 | Excellent 37.4% |
| Tsimshian | 84.7 /100 | #150 | Excellent 37.4% |
| Immigrants | Poland | 84.4 /100 | #151 | Excellent 37.3% |
| Immigrants | Sierra Leone | 83.6 /100 | #152 | Excellent 37.3% |
| Arapaho | 81.8 /100 | #153 | Excellent 37.3% |
| Immigrants | Bulgaria | 81.6 /100 | #154 | Excellent 37.3% |
| Immigrants | Lithuania | 80.7 /100 | #155 | Excellent 37.2% |
| Kiowa | 80.4 /100 | #156 | Excellent 37.2% |
| Immigrants | Brazil | 76.5 /100 | #157 | Good 37.1% |
| Ute | 75.7 /100 | #158 | Good 37.1% |
| Yaqui | 74.4 /100 | #159 | Good 37.1% |