Belizean vs Honduran In Labor Force | Age 20-24
COMPARE
Belizean
Honduran
In Labor Force | Age 20-24
In Labor Force | Age 20-24 Comparison
Belizeans
Hondurans
73.4%
IN LABOR FORCE | AGE 20-24
0.3/ 100
METRIC RATING
272nd/ 347
METRIC RANK
74.8%
IN LABOR FORCE | AGE 20-24
32.7/ 100
METRIC RATING
188th/ 347
METRIC RANK
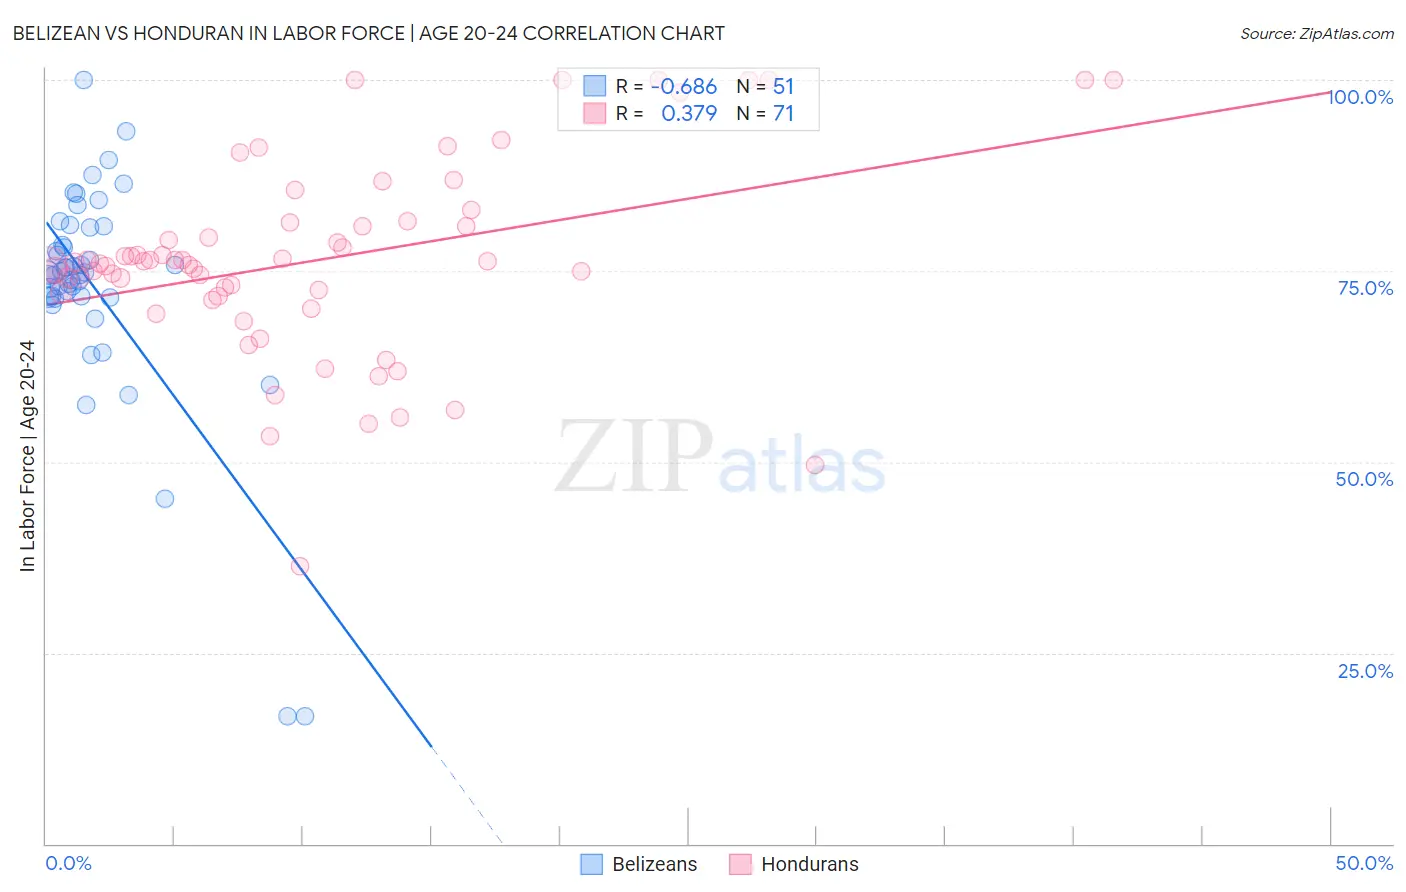
Belizean vs Honduran In Labor Force | Age 20-24 Correlation Chart
The statistical analysis conducted on geographies consisting of 144,207,582 people shows a significant negative correlation between the proportion of Belizeans and labor force participation rate among population between the ages 20 and 24 in the United States with a correlation coefficient (R) of -0.686 and weighted average of 73.4%. Similarly, the statistical analysis conducted on geographies consisting of 357,783,133 people shows a mild positive correlation between the proportion of Hondurans and labor force participation rate among population between the ages 20 and 24 in the United States with a correlation coefficient (R) of 0.379 and weighted average of 74.8%, a difference of 1.9%.
In Labor Force | Age 20-24 Correlation Summary
| Measurement | Belizean | Honduran |
| Minimum | 16.7% | 36.4% |
| Maximum | 100.0% | 100.0% |
| Range | 83.3% | 63.6% |
| Mean | 73.0% | 76.4% |
| Median | 74.6% | 76.1% |
| Interquartile 25% (IQ1) | 71.5% | 71.8% |
| Interquartile 75% (IQ3) | 80.8% | 81.3% |
| Interquartile Range (IQR) | 9.3% | 9.5% |
| Standard Deviation (Sample) | 14.6% | 12.8% |
| Standard Deviation (Population) | 14.5% | 12.7% |
Similar Demographics by In Labor Force | Age 20-24
Demographics Similar to Belizeans by In Labor Force | Age 20-24
In terms of in labor force | age 20-24, the demographic groups most similar to Belizeans are Immigrants from Indonesia (73.4%, a difference of 0.010%), Cheyenne (73.4%, a difference of 0.030%), Immigrants from Colombia (73.4%, a difference of 0.050%), Immigrants from Russia (73.5%, a difference of 0.060%), and Colombian (73.5%, a difference of 0.10%).
| Demographics | Rating | Rank | In Labor Force | Age 20-24 |
| Burmese | 0.5 /100 | #265 | Tragic 73.6% |
| Haitians | 0.5 /100 | #266 | Tragic 73.6% |
| Immigrants | Western Asia | 0.4 /100 | #267 | Tragic 73.5% |
| South Americans | 0.4 /100 | #268 | Tragic 73.5% |
| Colombians | 0.3 /100 | #269 | Tragic 73.5% |
| Immigrants | Russia | 0.3 /100 | #270 | Tragic 73.5% |
| Immigrants | Indonesia | 0.3 /100 | #271 | Tragic 73.4% |
| Belizeans | 0.3 /100 | #272 | Tragic 73.4% |
| Cheyenne | 0.2 /100 | #273 | Tragic 73.4% |
| Immigrants | Colombia | 0.2 /100 | #274 | Tragic 73.4% |
| Immigrants | South America | 0.2 /100 | #275 | Tragic 73.3% |
| Mongolians | 0.2 /100 | #276 | Tragic 73.3% |
| Immigrants | Malaysia | 0.2 /100 | #277 | Tragic 73.3% |
| Cypriots | 0.2 /100 | #278 | Tragic 73.3% |
| Venezuelans | 0.2 /100 | #279 | Tragic 73.3% |
Demographics Similar to Hondurans by In Labor Force | Age 20-24
In terms of in labor force | age 20-24, the demographic groups most similar to Hondurans are Immigrants from Northern Europe (74.8%, a difference of 0.0%), Immigrants from Honduras (74.9%, a difference of 0.010%), Russian (74.8%, a difference of 0.010%), Immigrants from Eastern Europe (74.9%, a difference of 0.020%), and Immigrants from Hungary (74.9%, a difference of 0.040%).
| Demographics | Rating | Rank | In Labor Force | Age 20-24 |
| Africans | 42.5 /100 | #181 | Average 75.0% |
| Immigrants | South Africa | 36.9 /100 | #182 | Fair 74.9% |
| Immigrants | Costa Rica | 36.7 /100 | #183 | Fair 74.9% |
| Immigrants | Hungary | 35.0 /100 | #184 | Fair 74.9% |
| Sri Lankans | 34.9 /100 | #185 | Fair 74.9% |
| Immigrants | Eastern Europe | 33.8 /100 | #186 | Fair 74.9% |
| Immigrants | Honduras | 33.5 /100 | #187 | Fair 74.9% |
| Hondurans | 32.7 /100 | #188 | Fair 74.8% |
| Immigrants | Northern Europe | 32.6 /100 | #189 | Fair 74.8% |
| Russians | 32.2 /100 | #190 | Fair 74.8% |
| Senegalese | 28.1 /100 | #191 | Fair 74.8% |
| Immigrants | Europe | 27.5 /100 | #192 | Fair 74.8% |
| Alsatians | 27.1 /100 | #193 | Fair 74.8% |
| Immigrants | Denmark | 25.8 /100 | #194 | Fair 74.8% |
| Eastern Europeans | 25.4 /100 | #195 | Fair 74.8% |