Belizean vs Immigrants from Nicaragua In Labor Force | Age 20-24
COMPARE
Belizean
Immigrants from Nicaragua
In Labor Force | Age 20-24
In Labor Force | Age 20-24 Comparison
Belizeans
Immigrants from Nicaragua
73.4%
IN LABOR FORCE | AGE 20-24
0.3/ 100
METRIC RATING
272nd/ 347
METRIC RANK
72.9%
IN LABOR FORCE | AGE 20-24
0.0/ 100
METRIC RATING
291st/ 347
METRIC RANK
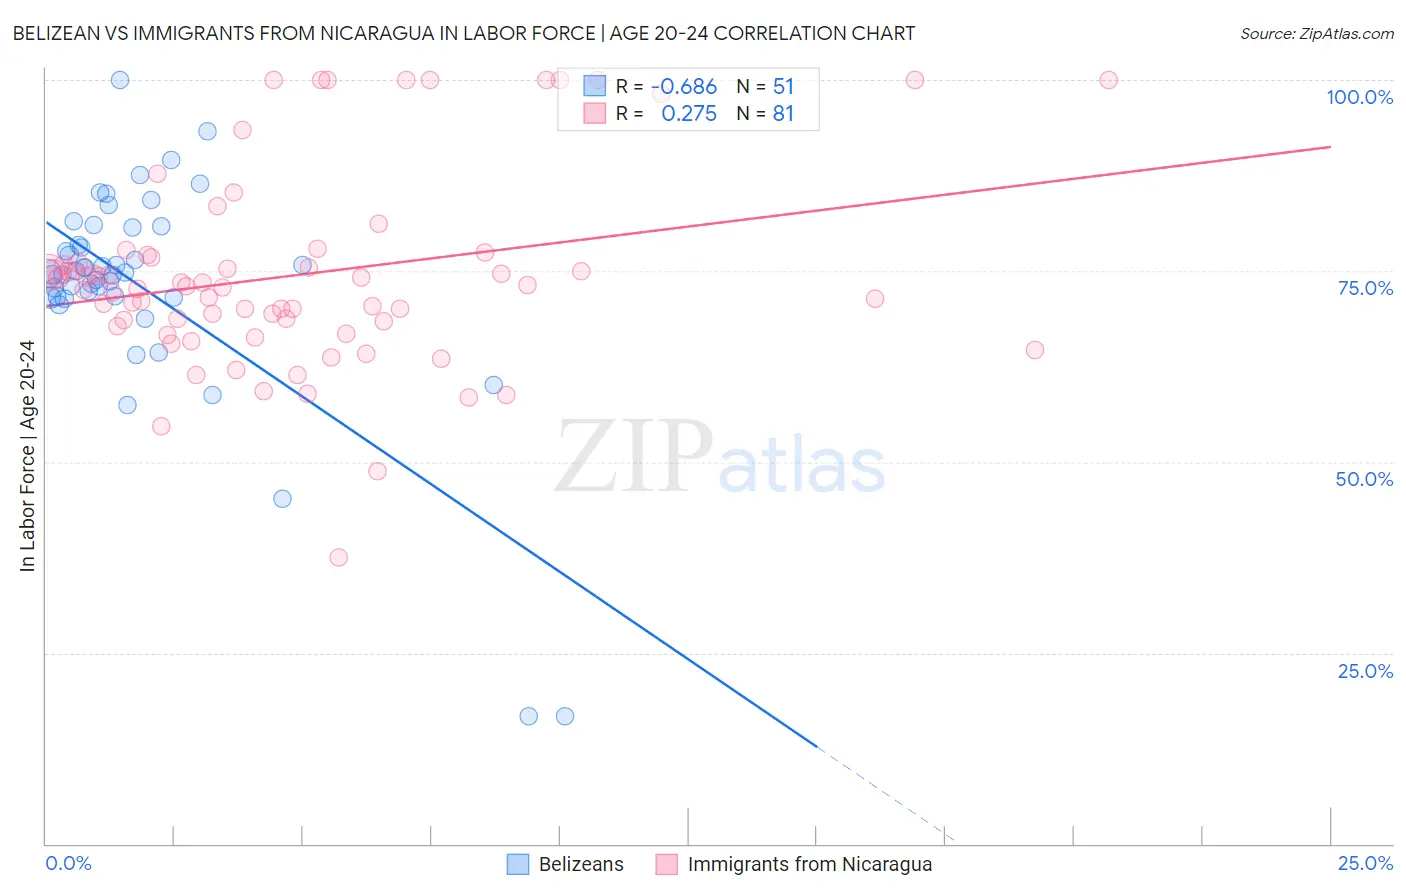
Belizean vs Immigrants from Nicaragua In Labor Force | Age 20-24 Correlation Chart
The statistical analysis conducted on geographies consisting of 144,207,582 people shows a significant negative correlation between the proportion of Belizeans and labor force participation rate among population between the ages 20 and 24 in the United States with a correlation coefficient (R) of -0.686 and weighted average of 73.4%. Similarly, the statistical analysis conducted on geographies consisting of 236,317,721 people shows a weak positive correlation between the proportion of Immigrants from Nicaragua and labor force participation rate among population between the ages 20 and 24 in the United States with a correlation coefficient (R) of 0.275 and weighted average of 72.9%, a difference of 0.67%.
In Labor Force | Age 20-24 Correlation Summary
| Measurement | Belizean | Immigrants from Nicaragua |
| Minimum | 16.7% | 37.5% |
| Maximum | 100.0% | 100.0% |
| Range | 83.3% | 62.5% |
| Mean | 73.0% | 74.5% |
| Median | 74.6% | 73.0% |
| Interquartile 25% (IQ1) | 71.5% | 68.1% |
| Interquartile 75% (IQ3) | 80.8% | 76.9% |
| Interquartile Range (IQR) | 9.3% | 8.8% |
| Standard Deviation (Sample) | 14.6% | 12.7% |
| Standard Deviation (Population) | 14.5% | 12.7% |
Demographics Similar to Belizeans and Immigrants from Nicaragua by In Labor Force | Age 20-24
In terms of in labor force | age 20-24, the demographic groups most similar to Belizeans are Immigrants from Indonesia (73.4%, a difference of 0.010%), Cheyenne (73.4%, a difference of 0.030%), Immigrants from Colombia (73.4%, a difference of 0.050%), Immigrants from South America (73.3%, a difference of 0.10%), and Mongolian (73.3%, a difference of 0.11%). Similarly, the demographic groups most similar to Immigrants from Nicaragua are Immigrants from Belarus (73.0%, a difference of 0.080%), U.S. Virgin Islander (73.0%, a difference of 0.15%), Argentinean (73.1%, a difference of 0.18%), Immigrants from Korea (73.1%, a difference of 0.27%), and Immigrants from Lebanon (73.1%, a difference of 0.29%).
| Demographics | Rating | Rank | In Labor Force | Age 20-24 |
| Immigrants | Indonesia | 0.3 /100 | #271 | Tragic 73.4% |
| Belizeans | 0.3 /100 | #272 | Tragic 73.4% |
| Cheyenne | 0.2 /100 | #273 | Tragic 73.4% |
| Immigrants | Colombia | 0.2 /100 | #274 | Tragic 73.4% |
| Immigrants | South America | 0.2 /100 | #275 | Tragic 73.3% |
| Mongolians | 0.2 /100 | #276 | Tragic 73.3% |
| Immigrants | Malaysia | 0.2 /100 | #277 | Tragic 73.3% |
| Cypriots | 0.2 /100 | #278 | Tragic 73.3% |
| Venezuelans | 0.2 /100 | #279 | Tragic 73.3% |
| Bahamians | 0.1 /100 | #280 | Tragic 73.3% |
| Immigrants | Venezuela | 0.1 /100 | #281 | Tragic 73.2% |
| Immigrants | Spain | 0.1 /100 | #282 | Tragic 73.2% |
| Immigrants | Bahamas | 0.1 /100 | #283 | Tragic 73.2% |
| Kiowa | 0.1 /100 | #284 | Tragic 73.2% |
| Nicaraguans | 0.1 /100 | #285 | Tragic 73.2% |
| Immigrants | Lebanon | 0.1 /100 | #286 | Tragic 73.1% |
| Immigrants | Korea | 0.1 /100 | #287 | Tragic 73.1% |
| Argentineans | 0.1 /100 | #288 | Tragic 73.1% |
| U.S. Virgin Islanders | 0.1 /100 | #289 | Tragic 73.0% |
| Immigrants | Belarus | 0.1 /100 | #290 | Tragic 73.0% |
| Immigrants | Nicaragua | 0.0 /100 | #291 | Tragic 72.9% |