Belgian vs U.S. Virgin Islander In Labor Force | Age 20-64
COMPARE
Belgian
U.S. Virgin Islander
In Labor Force | Age 20-64
In Labor Force | Age 20-64 Comparison
Belgians
U.S. Virgin Islanders
79.9%
IN LABOR FORCE | AGE 20-64
87.4/ 100
METRIC RATING
134th/ 347
METRIC RANK
78.4%
IN LABOR FORCE | AGE 20-64
0.1/ 100
METRIC RATING
267th/ 347
METRIC RANK
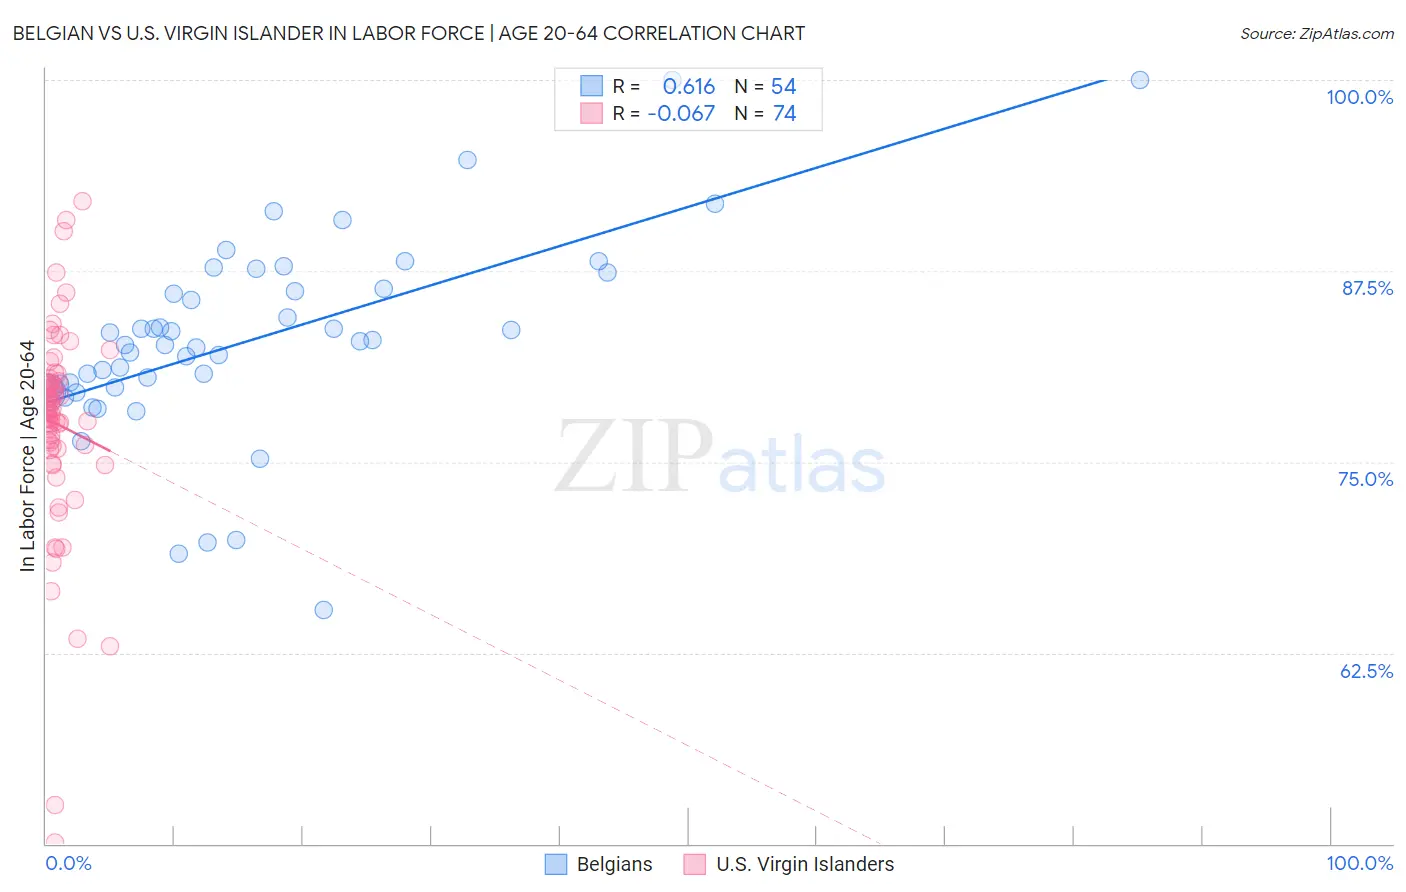
Belgian vs U.S. Virgin Islander In Labor Force | Age 20-64 Correlation Chart
The statistical analysis conducted on geographies consisting of 356,033,088 people shows a significant positive correlation between the proportion of Belgians and labor force participation rate among population between the ages 20 and 64 in the United States with a correlation coefficient (R) of 0.616 and weighted average of 79.9%. Similarly, the statistical analysis conducted on geographies consisting of 87,527,161 people shows a slight negative correlation between the proportion of U.S. Virgin Islanders and labor force participation rate among population between the ages 20 and 64 in the United States with a correlation coefficient (R) of -0.067 and weighted average of 78.4%, a difference of 1.9%.
In Labor Force | Age 20-64 Correlation Summary
| Measurement | Belgian | U.S. Virgin Islander |
| Minimum | 65.3% | 50.1% |
| Maximum | 100.0% | 92.1% |
| Range | 34.7% | 42.0% |
| Mean | 83.0% | 77.5% |
| Median | 82.8% | 78.4% |
| Interquartile 25% (IQ1) | 79.9% | 76.0% |
| Interquartile 75% (IQ3) | 86.3% | 80.2% |
| Interquartile Range (IQR) | 6.4% | 4.2% |
| Standard Deviation (Sample) | 6.5% | 6.9% |
| Standard Deviation (Population) | 6.5% | 6.8% |
Similar Demographics by In Labor Force | Age 20-64
Demographics Similar to Belgians by In Labor Force | Age 20-64
In terms of in labor force | age 20-64, the demographic groups most similar to Belgians are Indian (Asian) (79.9%, a difference of 0.0%), South American Indian (79.9%, a difference of 0.0%), Ukrainian (79.9%, a difference of 0.010%), Immigrants from Singapore (79.9%, a difference of 0.010%), and Immigrants from Zaire (79.9%, a difference of 0.020%).
| Demographics | Rating | Rank | In Labor Force | Age 20-64 |
| Immigrants | Czechoslovakia | 89.7 /100 | #127 | Excellent 79.9% |
| Immigrants | Eastern Asia | 89.4 /100 | #128 | Excellent 79.9% |
| Italians | 88.9 /100 | #129 | Excellent 79.9% |
| Immigrants | Zaire | 88.6 /100 | #130 | Excellent 79.9% |
| Immigrants | Iran | 88.3 /100 | #131 | Excellent 79.9% |
| Indians (Asian) | 87.7 /100 | #132 | Excellent 79.9% |
| South American Indians | 87.6 /100 | #133 | Excellent 79.9% |
| Belgians | 87.4 /100 | #134 | Excellent 79.9% |
| Ukrainians | 86.8 /100 | #135 | Excellent 79.9% |
| Immigrants | Singapore | 86.7 /100 | #136 | Excellent 79.9% |
| Immigrants | Ukraine | 86.5 /100 | #137 | Excellent 79.9% |
| Immigrants | Nigeria | 86.4 /100 | #138 | Excellent 79.9% |
| Immigrants | Spain | 83.9 /100 | #139 | Excellent 79.8% |
| Immigrants | South Eastern Asia | 80.4 /100 | #140 | Excellent 79.8% |
| Immigrants | Israel | 80.0 /100 | #141 | Good 79.8% |
Demographics Similar to U.S. Virgin Islanders by In Labor Force | Age 20-64
In terms of in labor force | age 20-64, the demographic groups most similar to U.S. Virgin Islanders are Bahamian (78.4%, a difference of 0.020%), West Indian (78.3%, a difference of 0.020%), British West Indian (78.4%, a difference of 0.030%), Pennsylvania German (78.4%, a difference of 0.070%), and Spaniard (78.4%, a difference of 0.070%).
| Demographics | Rating | Rank | In Labor Force | Age 20-64 |
| Immigrants | Fiji | 0.3 /100 | #260 | Tragic 78.6% |
| Whites/Caucasians | 0.2 /100 | #261 | Tragic 78.5% |
| Fijians | 0.1 /100 | #262 | Tragic 78.4% |
| Pennsylvania Germans | 0.1 /100 | #263 | Tragic 78.4% |
| Spaniards | 0.1 /100 | #264 | Tragic 78.4% |
| British West Indians | 0.1 /100 | #265 | Tragic 78.4% |
| Bahamians | 0.1 /100 | #266 | Tragic 78.4% |
| U.S. Virgin Islanders | 0.1 /100 | #267 | Tragic 78.4% |
| West Indians | 0.0 /100 | #268 | Tragic 78.3% |
| Immigrants | Barbados | 0.0 /100 | #269 | Tragic 78.3% |
| Scotch-Irish | 0.0 /100 | #270 | Tragic 78.3% |
| Immigrants | Latin America | 0.0 /100 | #271 | Tragic 78.3% |
| Marshallese | 0.0 /100 | #272 | Tragic 78.3% |
| French American Indians | 0.0 /100 | #273 | Tragic 78.2% |
| Aleuts | 0.0 /100 | #274 | Tragic 78.2% |