Basque vs Immigrants from Sierra Leone In Labor Force | Age 35-44
COMPARE
Basque
Immigrants from Sierra Leone
In Labor Force | Age 35-44
In Labor Force | Age 35-44 Comparison
Basques
Immigrants from Sierra Leone
83.6%
IN LABOR FORCE | AGE 35-44
0.3/ 100
METRIC RATING
257th/ 347
METRIC RANK
86.1%
IN LABOR FORCE | AGE 35-44
100.0/ 100
METRIC RATING
7th/ 347
METRIC RANK
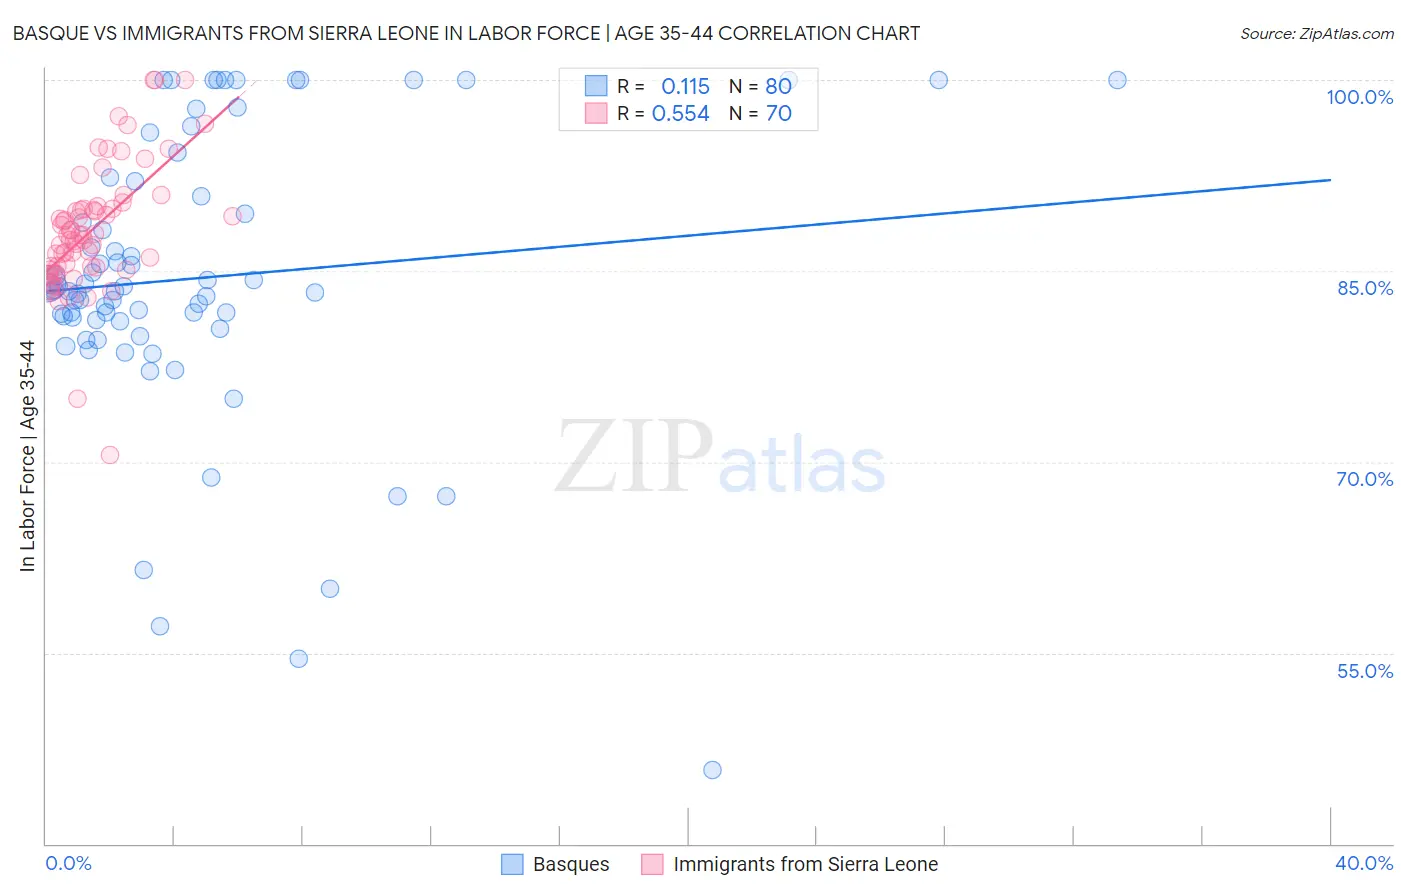
Basque vs Immigrants from Sierra Leone In Labor Force | Age 35-44 Correlation Chart
The statistical analysis conducted on geographies consisting of 165,759,018 people shows a poor positive correlation between the proportion of Basques and labor force participation rate among population between the ages 35 and 44 in the United States with a correlation coefficient (R) of 0.115 and weighted average of 83.6%. Similarly, the statistical analysis conducted on geographies consisting of 101,643,562 people shows a substantial positive correlation between the proportion of Immigrants from Sierra Leone and labor force participation rate among population between the ages 35 and 44 in the United States with a correlation coefficient (R) of 0.554 and weighted average of 86.1%, a difference of 3.0%.
In Labor Force | Age 35-44 Correlation Summary
| Measurement | Basque | Immigrants from Sierra Leone |
| Minimum | 45.8% | 70.5% |
| Maximum | 100.0% | 100.0% |
| Range | 54.2% | 29.5% |
| Mean | 84.4% | 88.2% |
| Median | 83.5% | 87.8% |
| Interquartile 25% (IQ1) | 81.1% | 85.3% |
| Interquartile 75% (IQ3) | 91.4% | 89.9% |
| Interquartile Range (IQR) | 10.3% | 4.6% |
| Standard Deviation (Sample) | 11.1% | 5.0% |
| Standard Deviation (Population) | 11.0% | 5.0% |
Similar Demographics by In Labor Force | Age 35-44
Demographics Similar to Basques by In Labor Force | Age 35-44
In terms of in labor force | age 35-44, the demographic groups most similar to Basques are Japanese (83.6%, a difference of 0.020%), Tsimshian (83.5%, a difference of 0.020%), Immigrants from the Azores (83.6%, a difference of 0.030%), Immigrants from El Salvador (83.5%, a difference of 0.050%), and Tongan (83.6%, a difference of 0.060%).
| Demographics | Rating | Rank | In Labor Force | Age 35-44 |
| Whites/Caucasians | 0.5 /100 | #250 | Tragic 83.6% |
| Salvadorans | 0.4 /100 | #251 | Tragic 83.6% |
| Immigrants | Guyana | 0.4 /100 | #252 | Tragic 83.6% |
| Lebanese | 0.4 /100 | #253 | Tragic 83.6% |
| Tongans | 0.4 /100 | #254 | Tragic 83.6% |
| Immigrants | Azores | 0.3 /100 | #255 | Tragic 83.6% |
| Japanese | 0.3 /100 | #256 | Tragic 83.6% |
| Basques | 0.3 /100 | #257 | Tragic 83.6% |
| Tsimshian | 0.2 /100 | #258 | Tragic 83.5% |
| Immigrants | El Salvador | 0.2 /100 | #259 | Tragic 83.5% |
| Vietnamese | 0.2 /100 | #260 | Tragic 83.5% |
| Immigrants | Dominica | 0.2 /100 | #261 | Tragic 83.5% |
| Immigrants | Congo | 0.2 /100 | #262 | Tragic 83.5% |
| Iroquois | 0.2 /100 | #263 | Tragic 83.5% |
| Scotch-Irish | 0.1 /100 | #264 | Tragic 83.5% |
Demographics Similar to Immigrants from Sierra Leone by In Labor Force | Age 35-44
In terms of in labor force | age 35-44, the demographic groups most similar to Immigrants from Sierra Leone are Bolivian (86.1%, a difference of 0.040%), Zimbabwean (86.1%, a difference of 0.050%), Immigrants from Ethiopia (85.9%, a difference of 0.17%), Immigrants from Cabo Verde (86.2%, a difference of 0.18%), and Ethiopian (85.9%, a difference of 0.18%).
| Demographics | Rating | Rank | In Labor Force | Age 35-44 |
| Sierra Leoneans | 100.0 /100 | #1 | Exceptional 86.4% |
| Luxembourgers | 100.0 /100 | #2 | Exceptional 86.4% |
| Immigrants | Bolivia | 100.0 /100 | #3 | Exceptional 86.2% |
| Immigrants | Cabo Verde | 100.0 /100 | #4 | Exceptional 86.2% |
| Zimbabweans | 100.0 /100 | #5 | Exceptional 86.1% |
| Bolivians | 100.0 /100 | #6 | Exceptional 86.1% |
| Immigrants | Sierra Leone | 100.0 /100 | #7 | Exceptional 86.1% |
| Immigrants | Ethiopia | 100.0 /100 | #8 | Exceptional 85.9% |
| Ethiopians | 100.0 /100 | #9 | Exceptional 85.9% |
| Cape Verdeans | 100.0 /100 | #10 | Exceptional 85.8% |
| Immigrants | Cameroon | 100.0 /100 | #11 | Exceptional 85.8% |
| Liberians | 100.0 /100 | #12 | Exceptional 85.7% |
| Somalis | 100.0 /100 | #13 | Exceptional 85.6% |
| Immigrants | Somalia | 100.0 /100 | #14 | Exceptional 85.6% |
| Norwegians | 100.0 /100 | #15 | Exceptional 85.6% |