Immigrants from Zimbabwe vs Immigrants from Sierra Leone In Labor Force | Age 35-44
COMPARE
Immigrants from Zimbabwe
Immigrants from Sierra Leone
In Labor Force | Age 35-44
In Labor Force | Age 35-44 Comparison
Immigrants from Zimbabwe
Immigrants from Sierra Leone
85.2%
IN LABOR FORCE | AGE 35-44
99.8/ 100
METRIC RATING
41st/ 347
METRIC RANK
86.1%
IN LABOR FORCE | AGE 35-44
100.0/ 100
METRIC RATING
7th/ 347
METRIC RANK
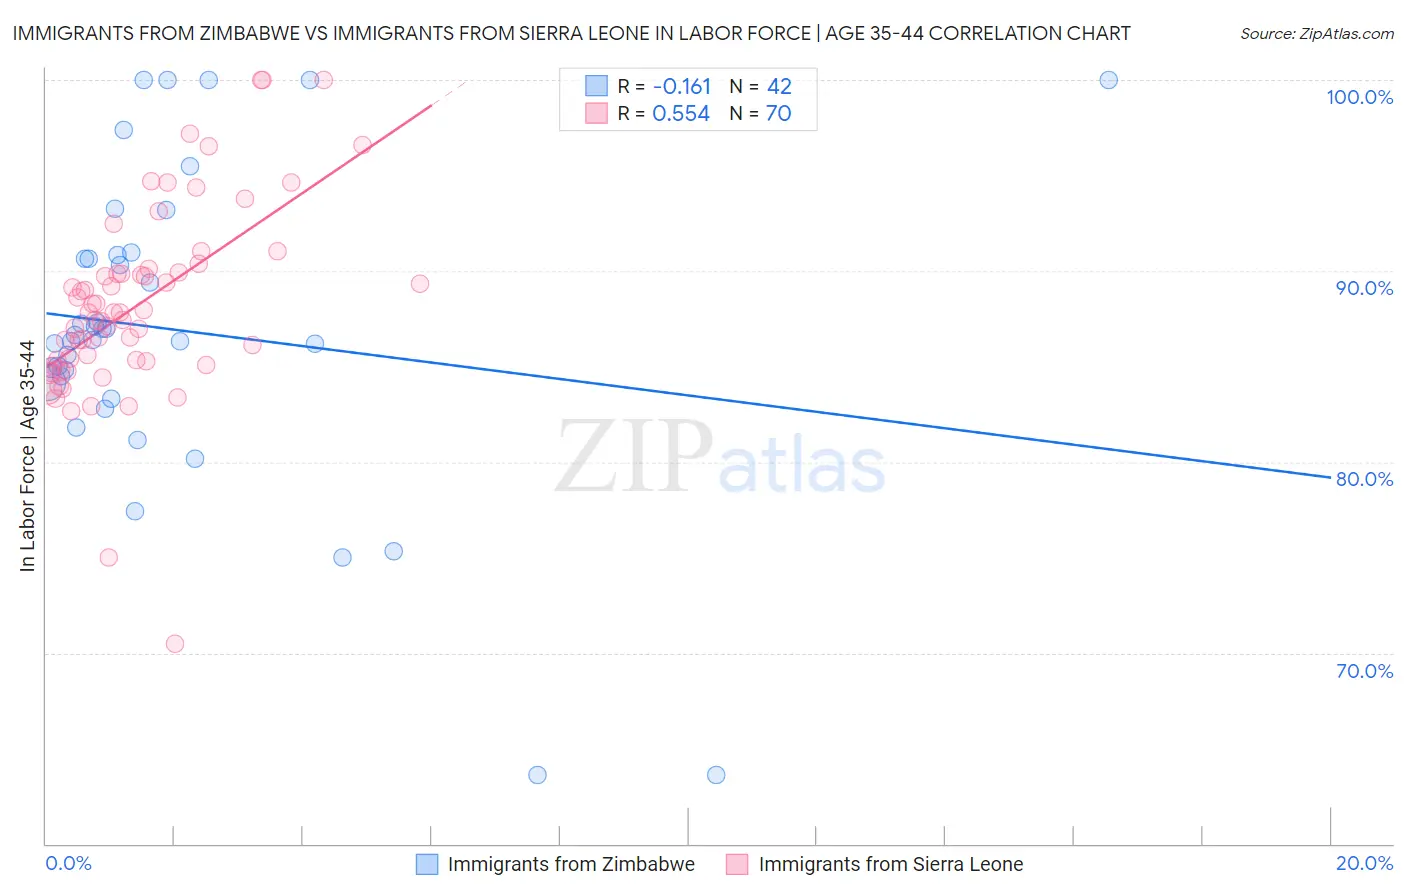
Immigrants from Zimbabwe vs Immigrants from Sierra Leone In Labor Force | Age 35-44 Correlation Chart
The statistical analysis conducted on geographies consisting of 117,794,320 people shows a poor negative correlation between the proportion of Immigrants from Zimbabwe and labor force participation rate among population between the ages 35 and 44 in the United States with a correlation coefficient (R) of -0.161 and weighted average of 85.2%. Similarly, the statistical analysis conducted on geographies consisting of 101,643,562 people shows a substantial positive correlation between the proportion of Immigrants from Sierra Leone and labor force participation rate among population between the ages 35 and 44 in the United States with a correlation coefficient (R) of 0.554 and weighted average of 86.1%, a difference of 0.98%.
In Labor Force | Age 35-44 Correlation Summary
| Measurement | Immigrants from Zimbabwe | Immigrants from Sierra Leone |
| Minimum | 63.6% | 70.5% |
| Maximum | 100.0% | 100.0% |
| Range | 36.4% | 29.5% |
| Mean | 86.9% | 88.2% |
| Median | 86.5% | 87.8% |
| Interquartile 25% (IQ1) | 84.1% | 85.3% |
| Interquartile 75% (IQ3) | 90.8% | 89.9% |
| Interquartile Range (IQR) | 6.7% | 4.6% |
| Standard Deviation (Sample) | 8.3% | 5.0% |
| Standard Deviation (Population) | 8.2% | 5.0% |
Similar Demographics by In Labor Force | Age 35-44
Demographics Similar to Immigrants from Zimbabwe by In Labor Force | Age 35-44
In terms of in labor force | age 35-44, the demographic groups most similar to Immigrants from Zimbabwe are Immigrants from Bulgaria (85.2%, a difference of 0.0%), Macedonian (85.2%, a difference of 0.0%), Immigrants from Poland (85.2%, a difference of 0.010%), Eastern European (85.2%, a difference of 0.010%), and Polish (85.2%, a difference of 0.010%).
| Demographics | Rating | Rank | In Labor Force | Age 35-44 |
| Immigrants | Nepal | 99.9 /100 | #34 | Exceptional 85.3% |
| Estonians | 99.9 /100 | #35 | Exceptional 85.3% |
| Immigrants | Morocco | 99.8 /100 | #36 | Exceptional 85.2% |
| Kenyans | 99.8 /100 | #37 | Exceptional 85.2% |
| Immigrants | Poland | 99.8 /100 | #38 | Exceptional 85.2% |
| Eastern Europeans | 99.8 /100 | #39 | Exceptional 85.2% |
| Immigrants | Bulgaria | 99.8 /100 | #40 | Exceptional 85.2% |
| Immigrants | Zimbabwe | 99.8 /100 | #41 | Exceptional 85.2% |
| Macedonians | 99.8 /100 | #42 | Exceptional 85.2% |
| Poles | 99.8 /100 | #43 | Exceptional 85.2% |
| Lithuanians | 99.8 /100 | #44 | Exceptional 85.2% |
| Cypriots | 99.8 /100 | #45 | Exceptional 85.2% |
| Immigrants | Hong Kong | 99.8 /100 | #46 | Exceptional 85.2% |
| German Russians | 99.8 /100 | #47 | Exceptional 85.2% |
| Immigrants | Eritrea | 99.7 /100 | #48 | Exceptional 85.2% |
Demographics Similar to Immigrants from Sierra Leone by In Labor Force | Age 35-44
In terms of in labor force | age 35-44, the demographic groups most similar to Immigrants from Sierra Leone are Bolivian (86.1%, a difference of 0.040%), Zimbabwean (86.1%, a difference of 0.050%), Immigrants from Ethiopia (85.9%, a difference of 0.17%), Immigrants from Cabo Verde (86.2%, a difference of 0.18%), and Ethiopian (85.9%, a difference of 0.18%).
| Demographics | Rating | Rank | In Labor Force | Age 35-44 |
| Sierra Leoneans | 100.0 /100 | #1 | Exceptional 86.4% |
| Luxembourgers | 100.0 /100 | #2 | Exceptional 86.4% |
| Immigrants | Bolivia | 100.0 /100 | #3 | Exceptional 86.2% |
| Immigrants | Cabo Verde | 100.0 /100 | #4 | Exceptional 86.2% |
| Zimbabweans | 100.0 /100 | #5 | Exceptional 86.1% |
| Bolivians | 100.0 /100 | #6 | Exceptional 86.1% |
| Immigrants | Sierra Leone | 100.0 /100 | #7 | Exceptional 86.1% |
| Immigrants | Ethiopia | 100.0 /100 | #8 | Exceptional 85.9% |
| Ethiopians | 100.0 /100 | #9 | Exceptional 85.9% |
| Cape Verdeans | 100.0 /100 | #10 | Exceptional 85.8% |
| Immigrants | Cameroon | 100.0 /100 | #11 | Exceptional 85.8% |
| Liberians | 100.0 /100 | #12 | Exceptional 85.7% |
| Somalis | 100.0 /100 | #13 | Exceptional 85.6% |
| Immigrants | Somalia | 100.0 /100 | #14 | Exceptional 85.6% |
| Norwegians | 100.0 /100 | #15 | Exceptional 85.6% |