Basque vs Egyptian In Labor Force | Age 35-44
COMPARE
Basque
Egyptian
In Labor Force | Age 35-44
In Labor Force | Age 35-44 Comparison
Basques
Egyptians
83.6%
IN LABOR FORCE | AGE 35-44
0.3/ 100
METRIC RATING
257th/ 347
METRIC RANK
84.8%
IN LABOR FORCE | AGE 35-44
96.6/ 100
METRIC RATING
97th/ 347
METRIC RANK
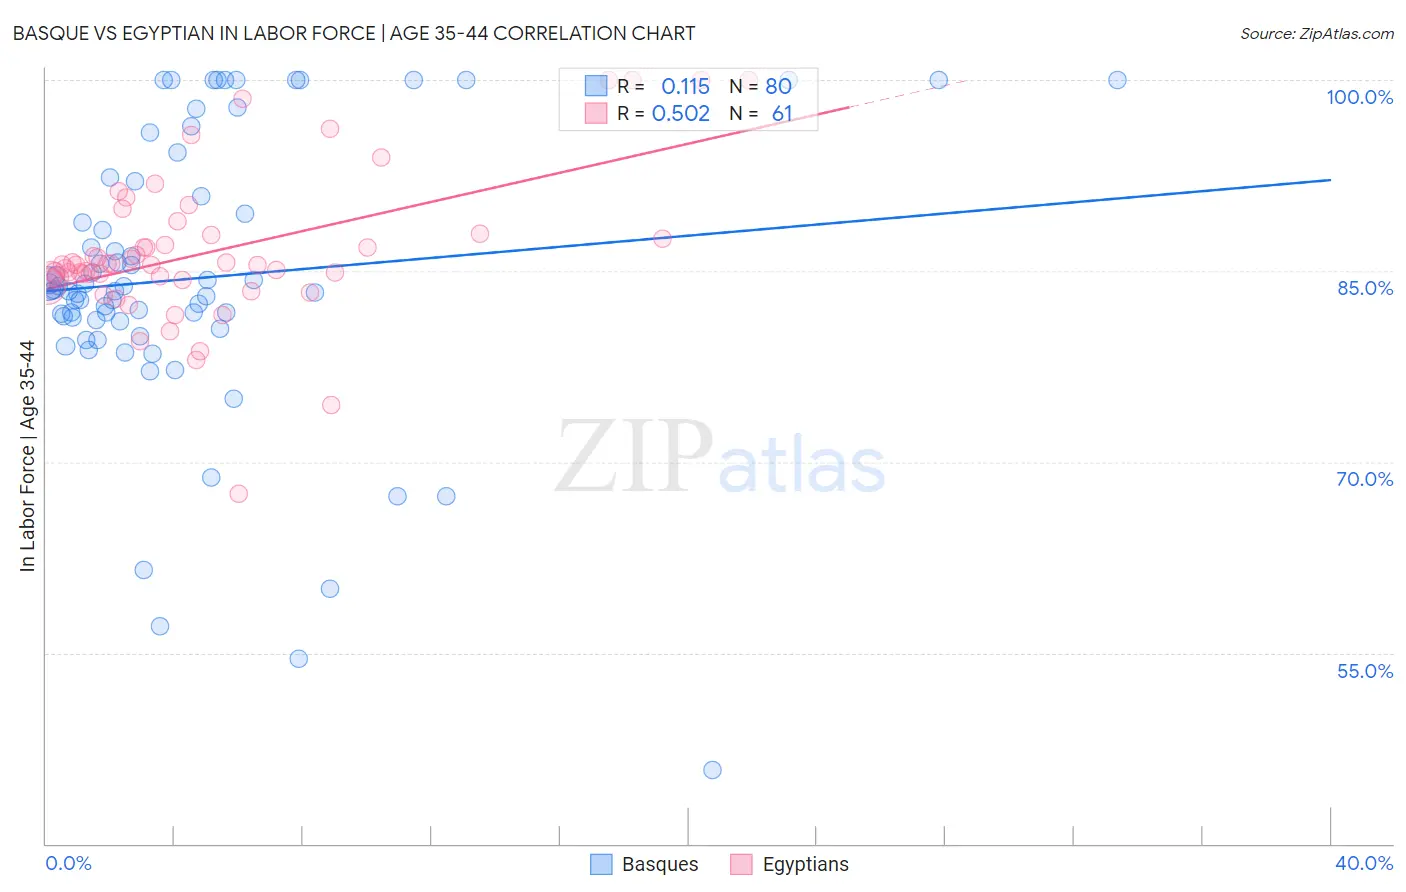
Basque vs Egyptian In Labor Force | Age 35-44 Correlation Chart
The statistical analysis conducted on geographies consisting of 165,759,018 people shows a poor positive correlation between the proportion of Basques and labor force participation rate among population between the ages 35 and 44 in the United States with a correlation coefficient (R) of 0.115 and weighted average of 83.6%. Similarly, the statistical analysis conducted on geographies consisting of 276,798,546 people shows a substantial positive correlation between the proportion of Egyptians and labor force participation rate among population between the ages 35 and 44 in the United States with a correlation coefficient (R) of 0.502 and weighted average of 84.8%, a difference of 1.5%.
In Labor Force | Age 35-44 Correlation Summary
| Measurement | Basque | Egyptian |
| Minimum | 45.8% | 67.5% |
| Maximum | 100.0% | 100.0% |
| Range | 54.2% | 32.5% |
| Mean | 84.4% | 86.5% |
| Median | 83.5% | 85.5% |
| Interquartile 25% (IQ1) | 81.1% | 84.4% |
| Interquartile 75% (IQ3) | 91.4% | 87.8% |
| Interquartile Range (IQR) | 10.3% | 3.5% |
| Standard Deviation (Sample) | 11.1% | 5.9% |
| Standard Deviation (Population) | 11.0% | 5.9% |
Similar Demographics by In Labor Force | Age 35-44
Demographics Similar to Basques by In Labor Force | Age 35-44
In terms of in labor force | age 35-44, the demographic groups most similar to Basques are Japanese (83.6%, a difference of 0.020%), Tsimshian (83.5%, a difference of 0.020%), Immigrants from the Azores (83.6%, a difference of 0.030%), Immigrants from El Salvador (83.5%, a difference of 0.050%), and Tongan (83.6%, a difference of 0.060%).
| Demographics | Rating | Rank | In Labor Force | Age 35-44 |
| Whites/Caucasians | 0.5 /100 | #250 | Tragic 83.6% |
| Salvadorans | 0.4 /100 | #251 | Tragic 83.6% |
| Immigrants | Guyana | 0.4 /100 | #252 | Tragic 83.6% |
| Lebanese | 0.4 /100 | #253 | Tragic 83.6% |
| Tongans | 0.4 /100 | #254 | Tragic 83.6% |
| Immigrants | Azores | 0.3 /100 | #255 | Tragic 83.6% |
| Japanese | 0.3 /100 | #256 | Tragic 83.6% |
| Basques | 0.3 /100 | #257 | Tragic 83.6% |
| Tsimshian | 0.2 /100 | #258 | Tragic 83.5% |
| Immigrants | El Salvador | 0.2 /100 | #259 | Tragic 83.5% |
| Vietnamese | 0.2 /100 | #260 | Tragic 83.5% |
| Immigrants | Dominica | 0.2 /100 | #261 | Tragic 83.5% |
| Immigrants | Congo | 0.2 /100 | #262 | Tragic 83.5% |
| Iroquois | 0.2 /100 | #263 | Tragic 83.5% |
| Scotch-Irish | 0.1 /100 | #264 | Tragic 83.5% |
Demographics Similar to Egyptians by In Labor Force | Age 35-44
In terms of in labor force | age 35-44, the demographic groups most similar to Egyptians are Immigrants from Kuwait (84.8%, a difference of 0.0%), Cuban (84.8%, a difference of 0.0%), Mongolian (84.8%, a difference of 0.010%), Indian (Asian) (84.8%, a difference of 0.020%), and Immigrants from Europe (84.9%, a difference of 0.030%).
| Demographics | Rating | Rank | In Labor Force | Age 35-44 |
| Immigrants | France | 97.4 /100 | #90 | Exceptional 84.9% |
| Immigrants | Europe | 97.2 /100 | #91 | Exceptional 84.9% |
| Ghanaians | 97.2 /100 | #92 | Exceptional 84.8% |
| Immigrants | Northern Africa | 97.1 /100 | #93 | Exceptional 84.8% |
| Mongolians | 96.8 /100 | #94 | Exceptional 84.8% |
| Immigrants | Kuwait | 96.7 /100 | #95 | Exceptional 84.8% |
| Cubans | 96.6 /100 | #96 | Exceptional 84.8% |
| Egyptians | 96.6 /100 | #97 | Exceptional 84.8% |
| Indians (Asian) | 96.1 /100 | #98 | Exceptional 84.8% |
| Haitians | 96.0 /100 | #99 | Exceptional 84.8% |
| Immigrants | Czechoslovakia | 95.9 /100 | #100 | Exceptional 84.8% |
| Immigrants | Australia | 95.5 /100 | #101 | Exceptional 84.8% |
| Immigrants | Southern Europe | 95.3 /100 | #102 | Exceptional 84.8% |
| Immigrants | Belarus | 95.3 /100 | #103 | Exceptional 84.8% |
| Immigrants | Sweden | 95.2 /100 | #104 | Exceptional 84.8% |