Immigrants from Northern Africa vs Immigrants from Sierra Leone In Labor Force | Age 35-44

COMPARE

Immigrants from Northern Africa
Race
Ancestry
AfghanAfricanAlaska NativeAlaskan AthabascanAlbanianAleutAlsatianAmericanApacheArabArapahoArgentineanArmenianAssyrian/Chaldean/SyriacAustralianAustrianBahamianBangladeshiBarbadianBasqueBelgianBelizeanBermudanBhutaneseBlackfeetBolivianBrazilianBritishBritish West IndianBulgarianBurmeseCajunCambodianCanadianCape VerdeanCarpatho RusynCelticCentral AmericanCentral American IndianCherokeeCheyenneChickasawChileanChineseChippewaChoctawColombianColvilleComancheCosta RicanCreeCreekCroatianCrowCubanCypriotCzechCzechoslovakianDanishDelawareDominicanDutchDutch West IndianEastern EuropeanEcuadorianEgyptianEnglishEstonianEthiopianEuropeanFijianFilipinoFinnishFrenchFrench American IndianFrench CanadianGermanGerman RussianGhanaianGreekGuamanian/ChamorroGuatemalanGuyaneseHaitianHmongHonduranHopiHoumaHungarianIcelanderIndian (Asian)IndonesianInupiatIranianIraqiIrishIroquoisIsraeliItalianJamaicanJapaneseJordanianKenyanKiowaKoreanLaotianLatvianLebaneseLiberianLithuanianLumbeeLuxembourgerMacedonianMalaysianMalteseMarshalleseMenomineeMexicanMexican American IndianMongolianMoroccanNative HawaiianNavajoNepaleseNew ZealanderNicaraguanNigerianNorthern EuropeanNorwegianOkinawanOsageOttawaPaiutePakistaniPalestinianPanamanianParaguayanPennsylvania GermanPeruvianPimaPolishPortuguesePotawatomiPuebloPuerto RicanPuget Sound SalishRomanianRussianSalvadoranSamoanScandinavianScotch-IrishScottishSeminoleSenegaleseSerbianShoshoneSierra LeoneanSiouxSlavicSlovakSloveneSomaliSouth AfricanSouth AmericanSouth American IndianSoviet UnionSpaniardSpanishSpanish AmericanSpanish American IndianSri LankanSubsaharan AfricanSudaneseSwedishSwissSyrianTaiwaneseThaiTlingit-HaidaTohono O'OdhamTonganTrinidadian and TobagonianTsimshianTurkishU.S. Virgin IslanderUgandanUkrainianUruguayanUteVenezuelanVietnameseWelshWest IndianYakamaYaquiYugoslavianYumanYup'ikZimbabwean
Immigration
NonimmigrantsImmigrantsAfghanistanAfricaAlbaniaArgentinaArmeniaAsiaAustraliaAustriaBahamasBangladeshBarbadosBelarusBelgiumBelizeBoliviaBosnia and HerzegovinaBrazilBulgariaBurma/MyanmarCabo VerdeCambodiaCameroonCanadaCaribbeanCentral AmericaChileChinaColombiaCongoCosta RicaCroatiaCubaCzechoslovakiaDenmarkDominicaDominican RepublicEastern AfricaEastern AsiaEastern EuropeEcuadorEgyptEl SalvadorEnglandEritreaEthiopiaEuropeFijiFranceGermanyGhanaGreeceGrenadaGuatemalaGuyanaHaitiHondurasHong KongHungaryIndiaIndonesiaIranIraqIrelandIsraelItalyJamaicaJapanJordanKazakhstanKenyaKoreaKuwaitLaosLatin AmericaLatviaLebanonLiberiaLithuaniaMalaysiaMexicoMicronesiaMiddle AfricaMoldovaMoroccoNepalNetherlandsNicaraguaNigeriaNorth AmericaNorth MacedoniaNorthern AfricaNorthern EuropeNorwayOceaniaPakistanPanamaPeruPhilippinesPolandPortugalRomaniaRussiaSaudi ArabiaScotlandSenegalSerbiaSingaporeSomaliaSouth AfricaSouth AmericaSouth Central AsiaSouth Eastern AsiaSouthern EuropeSpainSri LankaSt. Vincent and the GrenadinesSudanSwedenSwitzerlandSyriaTaiwanThailandTrinidad and TobagoTurkeyUgandaUkraineUruguayUzbekistanVenezuelaVietnamWest IndiesWestern AfricaWestern AsiaWestern EuropeYemenZaireZimbabweAzores
Immigrants from Sierra Leone
Race
Ancestry
AfghanAfricanAlaska NativeAlaskan AthabascanAlbanianAleutAlsatianAmericanApacheArabArapahoArgentineanArmenianAssyrian/Chaldean/SyriacAustralianAustrianBahamianBangladeshiBarbadianBasqueBelgianBelizeanBermudanBhutaneseBlackfeetBolivianBrazilianBritishBritish West IndianBulgarianBurmeseCajunCambodianCanadianCape VerdeanCarpatho RusynCelticCentral AmericanCentral American IndianCherokeeCheyenneChickasawChileanChineseChippewaChoctawColombianColvilleComancheCosta RicanCreeCreekCroatianCrowCubanCypriotCzechCzechoslovakianDanishDelawareDominicanDutchDutch West IndianEastern EuropeanEcuadorianEgyptianEnglishEstonianEthiopianEuropeanFijianFilipinoFinnishFrenchFrench American IndianFrench CanadianGermanGerman RussianGhanaianGreekGuamanian/ChamorroGuatemalanGuyaneseHaitianHmongHonduranHopiHoumaHungarianIcelanderIndian (Asian)IndonesianInupiatIranianIraqiIrishIroquoisIsraeliItalianJamaicanJapaneseJordanianKenyanKiowaKoreanLaotianLatvianLebaneseLiberianLithuanianLumbeeLuxembourgerMacedonianMalaysianMalteseMarshalleseMenomineeMexicanMexican American IndianMongolianMoroccanNative HawaiianNavajoNepaleseNew ZealanderNicaraguanNigerianNorthern EuropeanNorwegianOkinawanOsageOttawaPaiutePakistaniPalestinianPanamanianParaguayanPennsylvania GermanPeruvianPimaPolishPortuguesePotawatomiPuebloPuerto RicanPuget Sound SalishRomanianRussianSalvadoranSamoanScandinavianScotch-IrishScottishSeminoleSenegaleseSerbianShoshoneSierra LeoneanSiouxSlavicSlovakSloveneSomaliSouth AfricanSouth AmericanSouth American IndianSoviet UnionSpaniardSpanishSpanish AmericanSpanish American IndianSri LankanSubsaharan AfricanSudaneseSwedishSwissSyrianTaiwaneseThaiTlingit-HaidaTohono O'OdhamTonganTrinidadian and TobagonianTsimshianTurkishU.S. Virgin IslanderUgandanUkrainianUruguayanUteVenezuelanVietnameseWelshWest IndianYakamaYaquiYugoslavianYumanYup'ikZimbabwean
Immigration
NonimmigrantsImmigrantsAfghanistanAfricaAlbaniaArgentinaArmeniaAsiaAustraliaAustriaBahamasBangladeshBarbadosBelarusBelgiumBelizeBoliviaBosnia and HerzegovinaBrazilBulgariaBurma/MyanmarCabo VerdeCambodiaCameroonCanadaCaribbeanCentral AmericaChileChinaColombiaCongoCosta RicaCroatiaCubaCzechoslovakiaDenmarkDominicaDominican RepublicEastern AfricaEastern AsiaEastern EuropeEcuadorEgyptEl SalvadorEnglandEritreaEthiopiaEuropeFijiFranceGermanyGhanaGreeceGrenadaGuatemalaGuyanaHaitiHondurasHong KongHungaryIndiaIndonesiaIranIraqIrelandIsraelItalyJamaicaJapanJordanKazakhstanKenyaKoreaKuwaitLaosLatin AmericaLatviaLebanonLiberiaLithuaniaMalaysiaMexicoMicronesiaMiddle AfricaMoldovaMoroccoNepalNetherlandsNicaraguaNigeriaNorth AmericaNorth MacedoniaNorthern EuropeNorwayOceaniaPakistanPanamaPeruPhilippinesPolandPortugalRomaniaRussiaSaudi ArabiaScotlandSenegalSerbiaSierra LeoneSingaporeSomaliaSouth AfricaSouth AmericaSouth Central AsiaSouth Eastern AsiaSouthern EuropeSpainSri LankaSt. Vincent and the GrenadinesSudanSwedenSwitzerlandSyriaTaiwanThailandTrinidad and TobagoTurkeyUgandaUkraineUruguayUzbekistanVenezuelaVietnamWest IndiesWestern AfricaWestern AsiaWestern EuropeYemenZaireZimbabweAzores
In Labor Force | Age 35-44
Income
Poverty
Unemployment
Labor Participation
Family Structure
Vehicle Availability
Education Level
Disability

In Labor Force | Age 35-44 Comparison

Immigrants from Northern Africa

Immigrants from Sierra Leone

Exceptional
Exceptional
84.8%
IN LABOR FORCE | AGE 35-44
97.1/ 100
METRIC RATING
93rd/ 347
METRIC RANK
86.1%
IN LABOR FORCE | AGE 35-44
100.0/ 100
METRIC RATING
7th/ 347
METRIC RANK

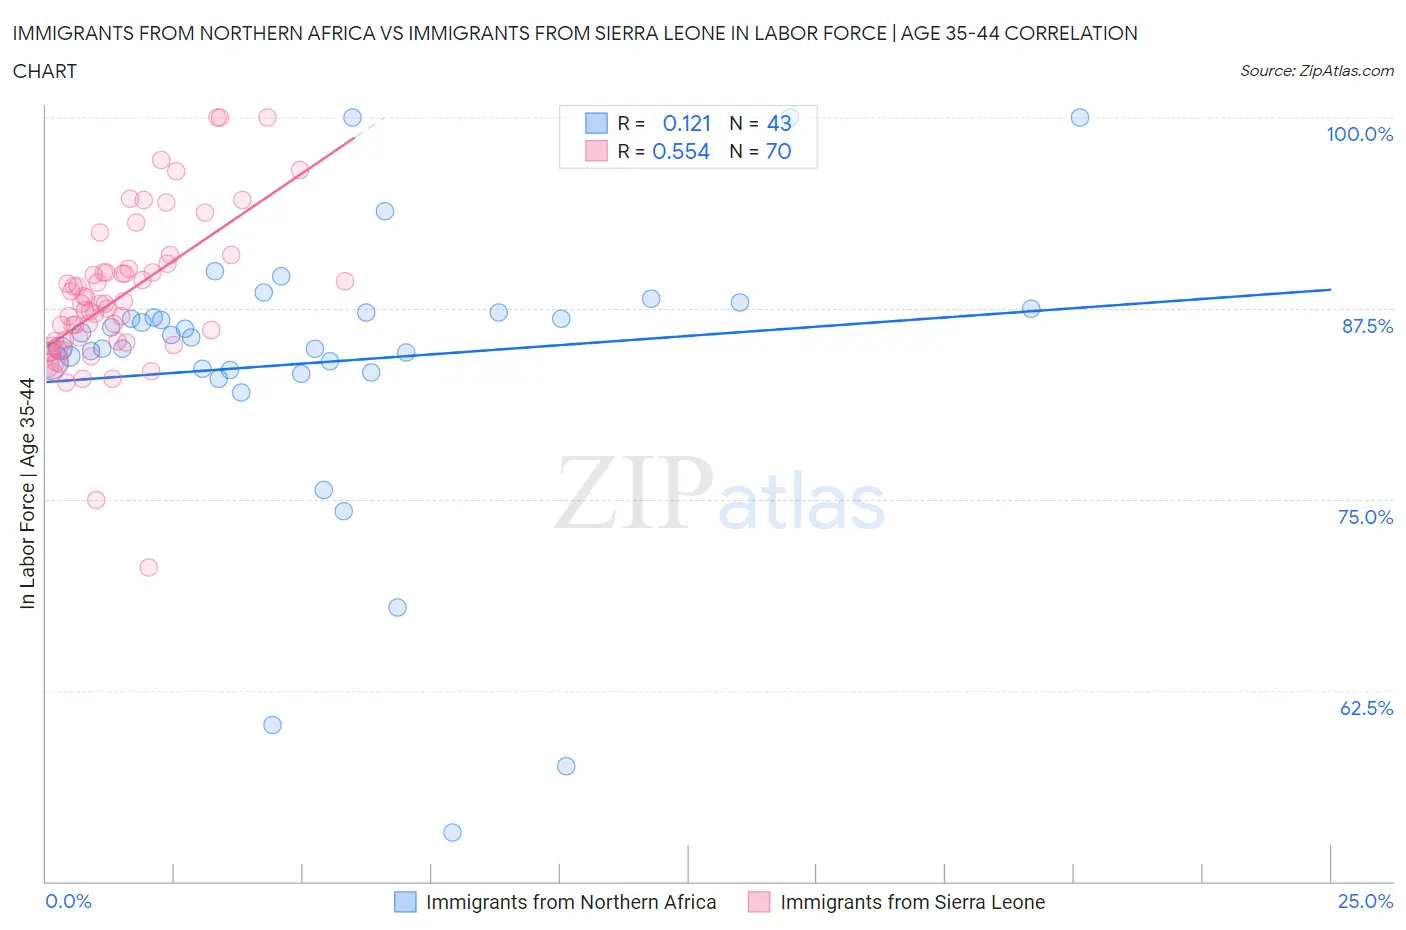
Immigrants from Northern Africa vs Immigrants from Sierra Leone In Labor Force | Age 35-44 Correlation Chart

The statistical analysis conducted on geographies consisting of 321,112,653 people shows a poor positive correlation between the proportion of Immigrants from Northern Africa and labor force participation rate among population between the ages 35 and 44 in the United States with a correlation coefficient (R) of 0.121 and weighted average of 84.8%. Similarly, the statistical analysis conducted on geographies consisting of 101,643,562 people shows a substantial positive correlation between the proportion of Immigrants from Sierra Leone and labor force participation rate among population between the ages 35 and 44 in the United States with a correlation coefficient (R) of 0.554 and weighted average of 86.1%, a difference of 1.4%.
Immigrants from Northern Africa vs Immigrants from Sierra Leone In Labor Force | Age 35-44

In Labor Force | Age 35-44 Correlation Summary

MeasurementImmigrants from Northern AfricaImmigrants from Sierra Leone
Minimum53.2%70.5%
Maximum100.0%100.0%
Range46.8%29.5%
Mean84.0%88.2%
Median85.6%87.8%
Interquartile 25% (IQ1)83.4%85.3%
Interquartile 75% (IQ3)87.3%89.9%
Interquartile Range (IQR)3.8%4.6%
Standard Deviation (Sample)9.4%5.0%
Standard Deviation (Population)9.3%5.0%

Similar Demographics by In Labor Force | Age 35-44

Demographics Similar to Immigrants from Northern Africa by In Labor Force | Age 35-44

In terms of in labor force | age 35-44, the demographic groups most similar to Immigrants from Northern Africa are Ghanaian (84.8%, a difference of 0.0%), Immigrants from Europe (84.9%, a difference of 0.010%), Immigrants from Pakistan (84.9%, a difference of 0.020%), Immigrants from France (84.9%, a difference of 0.020%), and Mongolian (84.8%, a difference of 0.020%).
DemographicsRating | RankIn Labor Force | Age 35-44
Greeks
97.8
/100
|
#86
Exceptional
84.9%
Belgians
97.7
/100
|
#87
Exceptional
84.9%
Yugoslavians
97.7
/100
|
#88
Exceptional
84.9%
Immigrants | Pakistan
97.5
/100
|
#89
Exceptional
84.9%
Immigrants | France
97.4
/100
|
#90
Exceptional
84.9%
Immigrants | Europe
97.2
/100
|
#91
Exceptional
84.9%
Ghanaians
97.2
/100
|
#92
Exceptional
84.8%
Immigrants | Northern Africa
97.1
/100
|
#93
Exceptional
84.8%
Mongolians
96.8
/100
|
#94
Exceptional
84.8%
Immigrants | Kuwait
96.7
/100
|
#95
Exceptional
84.8%
Cubans
96.6
/100
|
#96
Exceptional
84.8%
Egyptians
96.6
/100
|
#97
Exceptional
84.8%
Indians (Asian)
96.1
/100
|
#98
Exceptional
84.8%
Haitians
96.0
/100
|
#99
Exceptional
84.8%
Immigrants | Czechoslovakia
95.9
/100
|
#100
Exceptional
84.8%

Demographics Similar to Immigrants from Sierra Leone by In Labor Force | Age 35-44

In terms of in labor force | age 35-44, the demographic groups most similar to Immigrants from Sierra Leone are Bolivian (86.1%, a difference of 0.040%), Zimbabwean (86.1%, a difference of 0.050%), Immigrants from Ethiopia (85.9%, a difference of 0.17%), Immigrants from Cabo Verde (86.2%, a difference of 0.18%), and Ethiopian (85.9%, a difference of 0.18%).
DemographicsRating | RankIn Labor Force | Age 35-44
Sierra Leoneans
100.0
/100
|
#1
Exceptional
86.4%
Luxembourgers
100.0
/100
|
#2
Exceptional
86.4%
Immigrants | Bolivia
100.0
/100
|
#3
Exceptional
86.2%
Immigrants | Cabo Verde
100.0
/100
|
#4
Exceptional
86.2%
Zimbabweans
100.0
/100
|
#5
Exceptional
86.1%
Bolivians
100.0
/100
|
#6
Exceptional
86.1%
Immigrants | Sierra Leone
100.0
/100
|
#7
Exceptional
86.1%
Immigrants | Ethiopia
100.0
/100
|
#8
Exceptional
85.9%
Ethiopians
100.0
/100
|
#9
Exceptional
85.9%
Cape Verdeans
100.0
/100
|
#10
Exceptional
85.8%
Immigrants | Cameroon
100.0
/100
|
#11
Exceptional
85.8%
Liberians
100.0
/100
|
#12
Exceptional
85.7%
Somalis
100.0
/100
|
#13
Exceptional
85.6%
Immigrants | Somalia
100.0
/100
|
#14
Exceptional
85.6%
Norwegians
100.0
/100
|
#15
Exceptional
85.6%